Join Our Telegram channel to stay up to date on breaking news coverage
Ripple Price Prediction – January 28
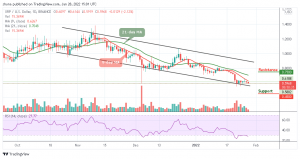
The Ripple price prediction shows that the XRP is down by 2.12% in the last 24 hours as the market value goes below $0.60.
XRP/USD Market
Key Levels:
Resistance levels: $0.75, $0.80, $0.85
Support levels: $0.45, $0.40, $0.35

XRP/USD opens today with the market price of $0.60 before giving a bearish signal, the coin is seen floating below the 9-day and 21-day moving averages as the technical indicator Relative Strength Index (14) resumes back into the oversold region. Meanwhile, a break below the lower boundary of the channel could give the market enough strength to dig dip but moving crossing above the 9-day MA may lead the market to a bullish scenario.
Ripple Price Prediction: Ripple Price May Move Sideways
At the time of writing, the Ripple price continues to demonstrate a sign of weakness across its markets. Looking at the daily chart, XRP/USD market is down by 2.12%, reflecting a price drop in the market and the fall might become heavy if the bearish action continues. Meanwhile, the Ripple (XRP) has been consolidating within the channel since the past few days.
However, if XRP/USD continue to move bearishly on the short-term outlook, traders may expect the trend to keep advancing lower. A break down below the channel could strengthen bears and bring the market price to the support levels of $0.45, $0.40, and $0.35 respectively, or a breakout above the 9-day and 21-day moving averages may lead the market in a bullish scenario and the price could hit the resistance levels of $0.75, $0.80, and critically $0.85.
Against BTC, XRP continues to move sideways within the channel but if the selling pressure continues, the Ripple price may likely create a new low for the market. However, the technical indicator Relative Strength Index (14) is seen heading to the south as the signal prepares to cross into the oversold region. More so, traders could see a negative move if XRP crosses below the lower boundary of the channel.
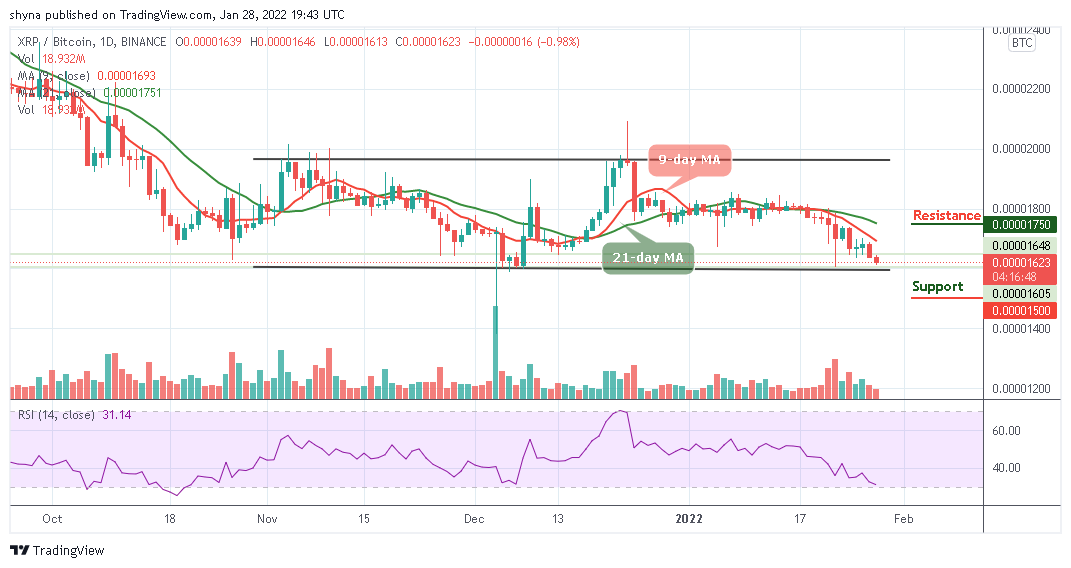
Nevertheless, XRP/BTC is currently moving at 1623 SAT. We may expect close support at 1500 SAT before breaking to 1450 SAT and critically 1400 SAT levels. Should in case a bullish movement occurs and moves above the 9-day moving average; a bull-run can be confirmed for the market and the nearest resistance levels could be found at 1750 SAT and above.
Looking to buy or trade Ripple (XRP) now? Invest at eToro!
68% of retail investor accounts lose money when trading CFDs with this provider
Join Our Telegram channel to stay up to date on breaking news coverage