Join Our Telegram channel to stay up to date on breaking news coverage
Ripple Price Prediction – May 14
Looking at the daily chart, after touching the low of $1.31, the Ripple price is trading in the positive territory, with gains of 1.01%.
XRP/USD Market
Key Levels:
Resistance levels: $1.80, $2.00, $2.20
Support levels: $0.80, $0.60, $0.40
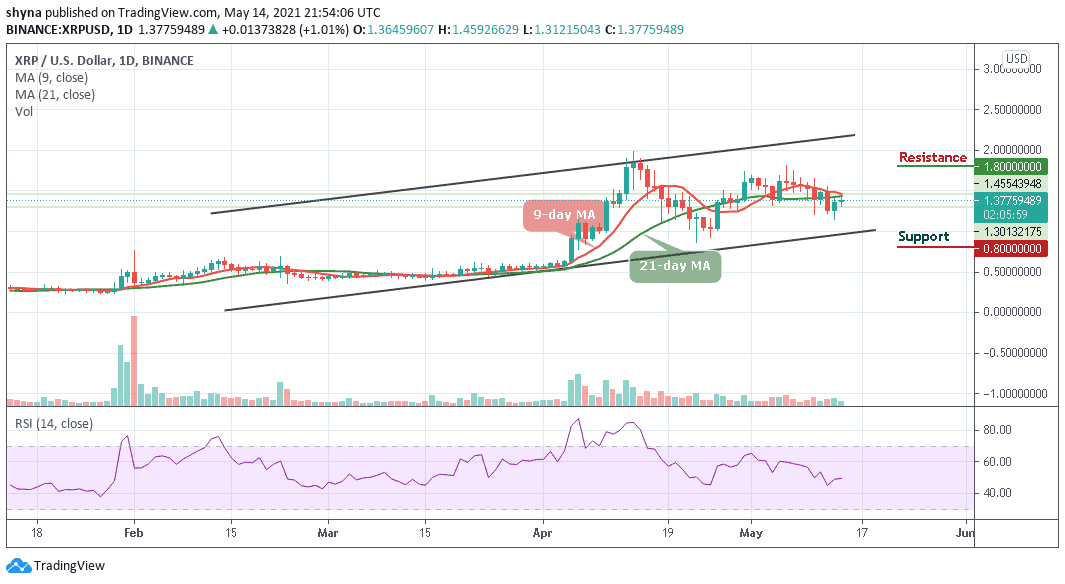
XRP/USD is making an attempt to rebound or see a slight push from the downward pressure. The Ripple price continues to move very tightly on a long-term uptrend support line. The bulls canceled out yesterday’s bearish action as the price settled around the $1.36 level. Meanwhile, the Relative Strength Index (14) indicator is trending around the neutral zone as the bulls and bears cancel each other out.
Ripple Price Prediction: What Could Be the Nest Direction?
As the daily chart revealed, XRP/USD continues to hover below the 9-day and 21-day moving averages at $0.275. Nevertheless, the pair remains strongly supported at $1.31 and would need to fall beneath this to head lower. More so, the Ripple price must break above the resistance at $1.45 to continue its bullish drive higher. However, if it falls below the current level of $1.37, the market could turn neutral, and a drop beneath the lower boundary of the channel would turn it bearish.
However, a bearish continuation could then bring the market to the critical supports at $0.80, $0.60, and $0.40 respectively. On the contrary, should the bulls continue with the upward movement, the Ripple price may likely move above the 9-day and 21-day moving averages to hit the potential resistance levels at $1.80, $2.00, and $2.20.
Against BTC, XRP is consolidating within the channel as the price moves above the 9-day and 21-day moving averages. Meanwhile, the buyers are trying to keep the price above this barrier and the bullish continuation may take it to the resistance levels of 3200 SAT and 3400 SAT respectively.
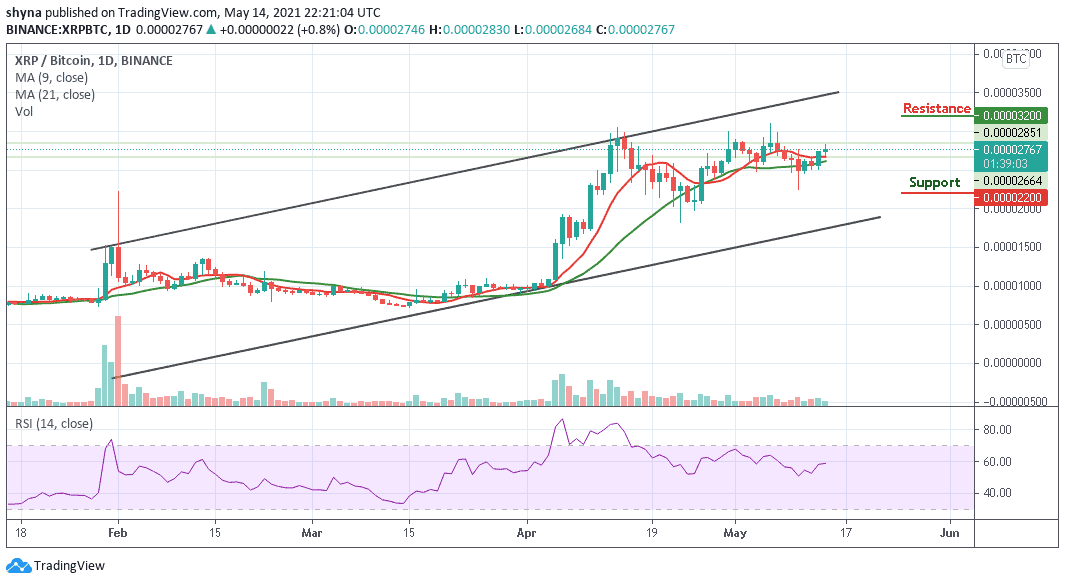
However, if the bulls failed to push the price above, then it could fall towards the lower boundary of the channel. The nearest support levels lie at 2200 SAT and 2000 SAT while the Relative Strength Index (14) moves below 60-level, which may likely give more bullish signals.
Join Our Telegram channel to stay up to date on breaking news coverage