Join Our Telegram channel to stay up to date on breaking news coverage
XRP Price Prediction – February 19
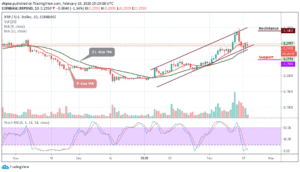
XRP/USD dropped by a sharp 1.34% over the past 24 hours of trading, bringing the price down to $0.295.
XRP/USD Market
Key Levels:
Resistance levels: $0.34, $0.35, $0.36
Support levels: $0.25, $0.24, $0.23

XRP/USD has been declining slowly below the key support against USD. As the technical indicator stochastic RSI remains within the oversold condition, the Ripple price might need to revisit the $0.280 support before it could start a new increase. More so, after struggling to stay above $0.299, the coin started a slow and steady decline today as it moves below the 9-day moving average at $0.291 support level moving into a short term bearish zone.
Moreover, XRP/USD is currently exchanging hands at $0.295 and any attempt to make it cross below the 21-day moving average could open the doors for more downsides and the price could spike below the $0.280 support level. However, traders should keep an eye on the $0.270 and $0.260 before creating a new weekly low at $0.25, $0.24 and $0.23 support levels.
Furthermore, the market may experience a quick buy once the trade reaches the support at $0.280. And if the price break above the 9-day moving average and successfully move towards the north, then a bullish breakout is likely to trigger more buying opportunity for traders, which might cause the price to hit $0.30 and further movement may take it to $0.34, $0.35 and $0.36 resistance levels.
When compared with Bitcoin, the Ripple (XRP) is consolidating within the channel as the price moves below the 9-day moving average. Meanwhile, the buyers are trying to push the price back above the moving average and the bullish continuation may take it to the resistance levels of 3200 SAT and 3300 SAT respectively.
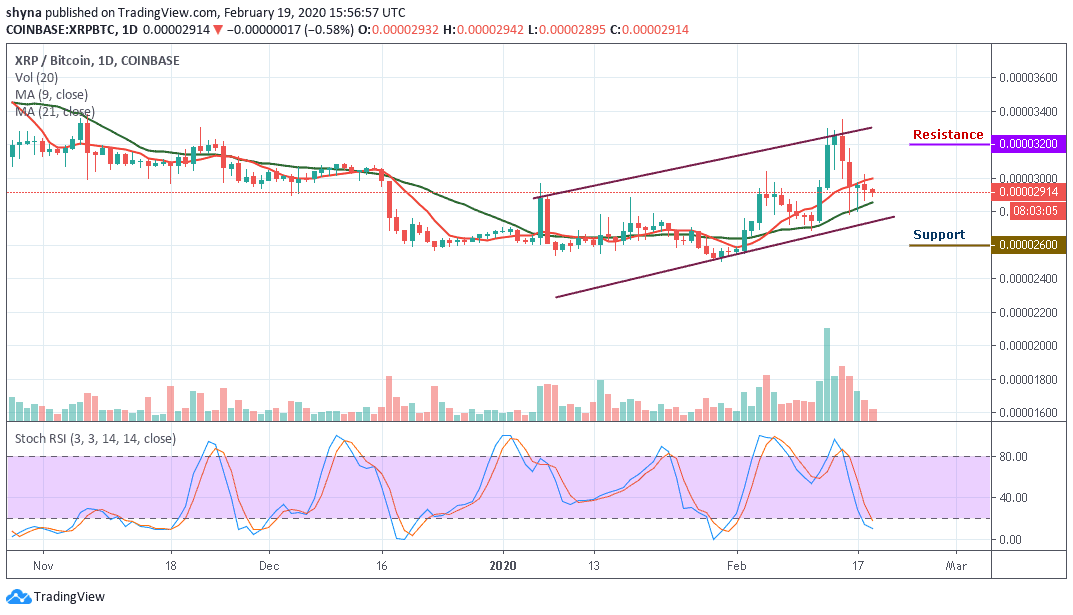
Looking at the daily chart, if the bulls failed to hold the price tight by pushing it upward, then it may likely fall below the 21-day moving average. The nearest support levels lie at 2600 SAT and 2500 SAT while the stochastic RSI moves into the oversold zone, which indicates a more downward movement.
Please note: Insidebitcoins.com is not a financial advisor. Do your research before investing your funds in any financial asset or presented product or event. We are not responsible for your investing results.
Join Our Telegram channel to stay up to date on breaking news coverage