
Join Our Telegram channel to stay up to date on breaking news coverage
Key Highlights
- Ripple price declined recently below the $0.4520 support and tested $0.4000 against the US dollar.
- There is a major bearish trend line formed with resistance at $0.4600 on the hourly chart of the XRP/USD pair (data source from Kraken).
- The pair could correct higher, but the previous support at $0.4520 may act as a resistance.
Ripple price failed to hold gains against the US Dollar and Bitcoin. XRP/USD declined towards $0.4000 and it is currently correcting higher.
Ripple Price Analysis
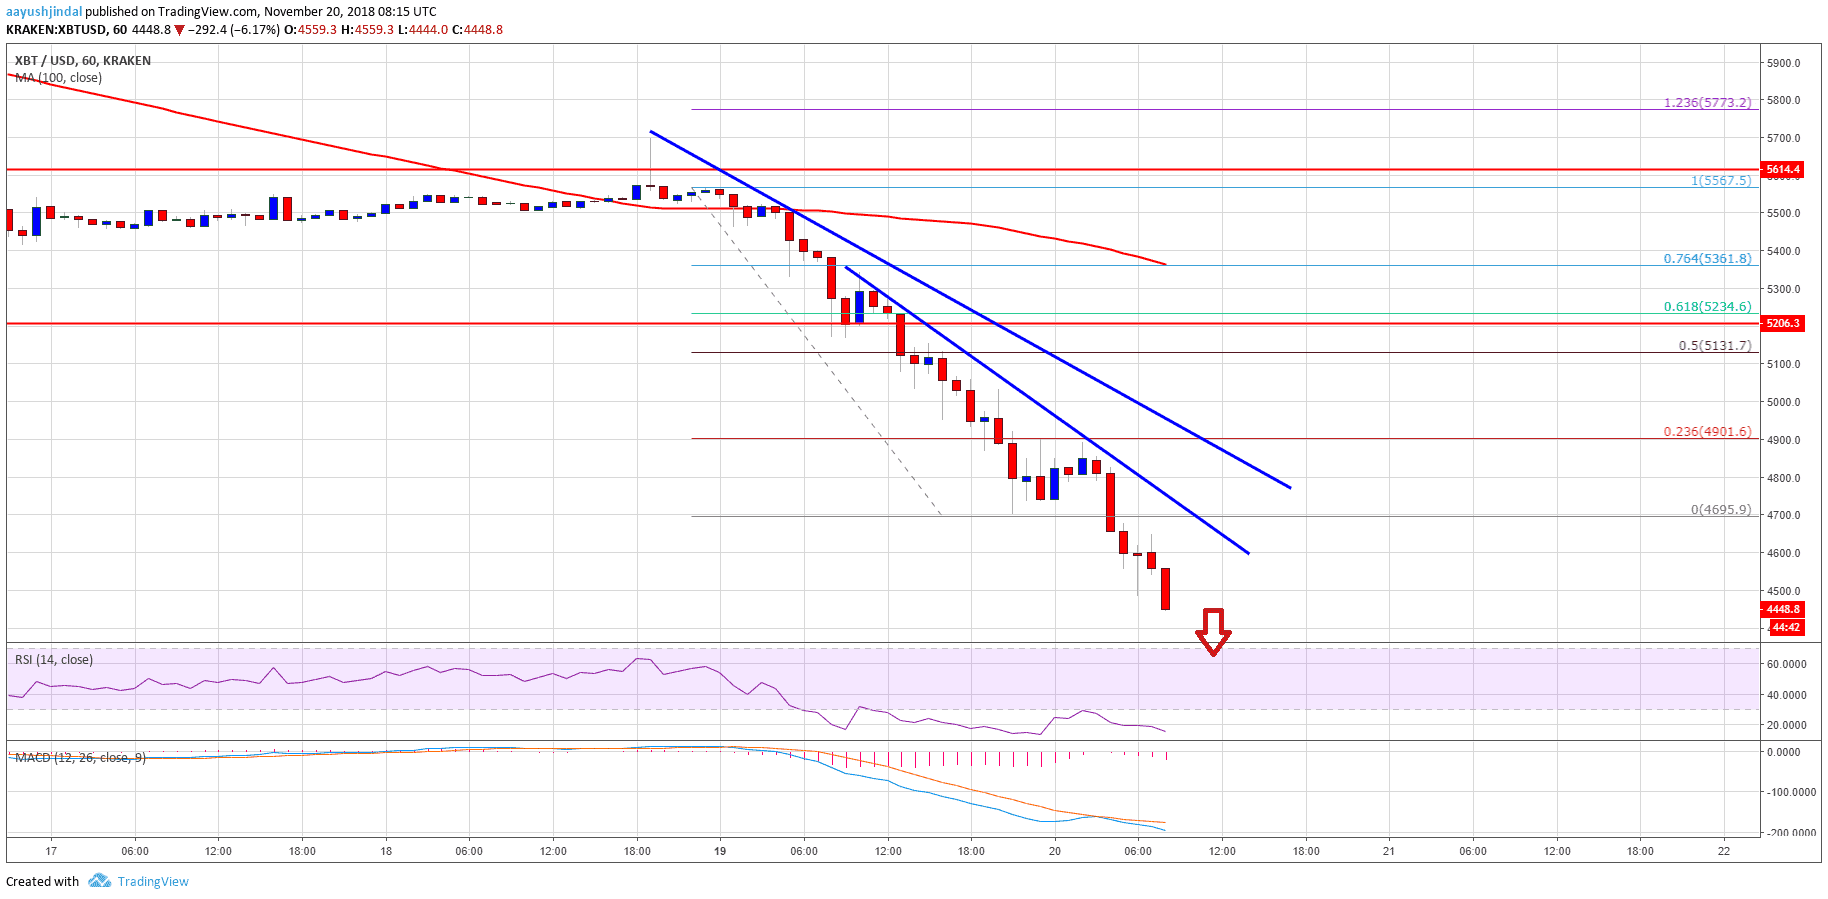
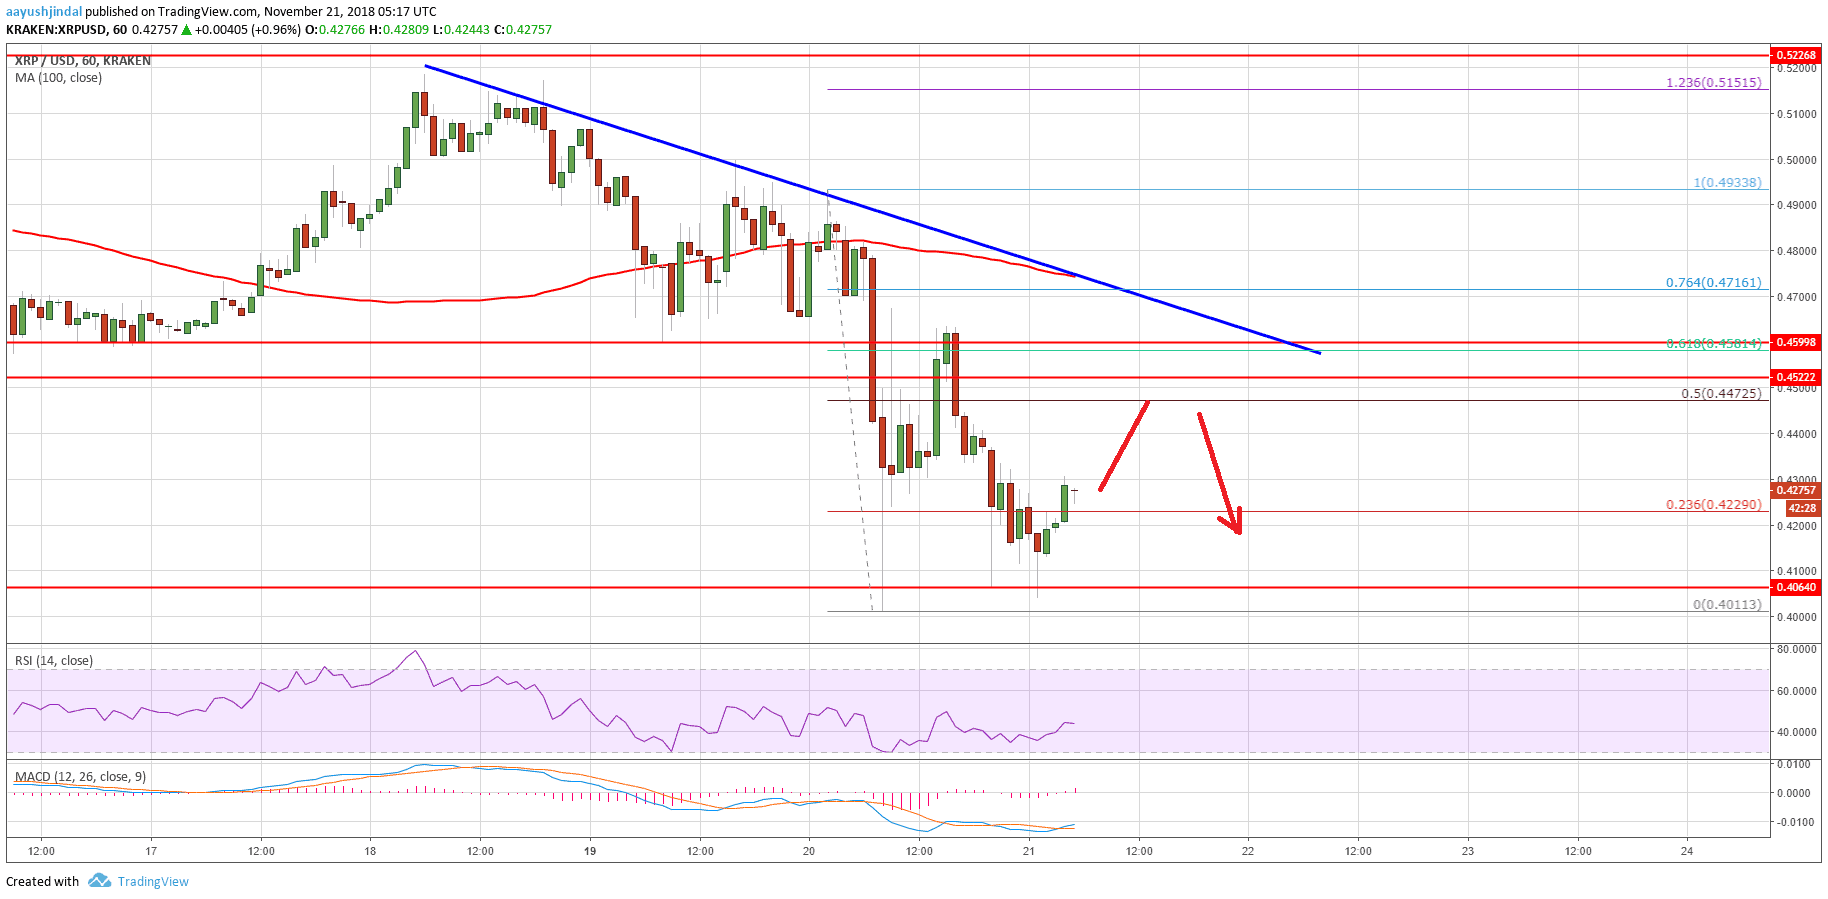
Yesterday, we saw how ripple price was resilient when bitcoin fell sharply against the US Dollar. However, buyers gave up later, resulting in a sharp decline below $0.4600 in the XRP/USD pair. The price declined below the $0.4520 and $0.4400 support levels. It even broke the $0.4200 support and settled below the 100 hourly simple moving average. A low was formed at $0.4011 and later the price started an upside correction.
The price recently moved above $0.4200 and the 23.6% Fib retracement level of the last drop from the $0.4933 high to $0.4011 low. However, there are many hurdles on the upside for buyers near the $0.4480 and $0.4500 levels. More importantly, the previous support at $0.4520 is likely to act as a strong resistance. Besides, there is a major bearish trend line formed with resistance at $0.4600 on the hourly chart of the XRP/USD pair. Therefore, if the price corrects higher from the current levels, it could find a strong barrier near $0.4520. Above $0.4520, the price could test $0.4720 and the 100 hourly SMA.

Looking at the chart, ripple price seems to be finding a decent support near $0.4000. Thus, the price may correct higher or consolidate in the short term above $0.4200 and $0.4300 before the next move.
Looking at the technical indicators:
Hourly MACD – The MACD for XRP/USD is slightly placed in the bullish zone.
Hourly RSI (Relative Strength Index) – The RSI for XRP/USD has recovered above the 40 level.
Major Support Level – $0.4000
Major Resistance Level – $0.4520
The post Ripple Price Analysis: XRP/USD’s Support Turned Resistance appeared first on NewsBTC.
Join Our Telegram channel to stay up to date on breaking news coverage