Join Our Telegram channel to stay up to date on breaking news coverage
XRP Price Prediction – April 22
The price of Ripple (XRP) has been moving in a tight range with a short-term bullish bias.
XRP/USD Market
Key Levels:
Resistance levels: $0.220, $0.230, $0.240
Support levels: $0.150, $0.140, $0.130
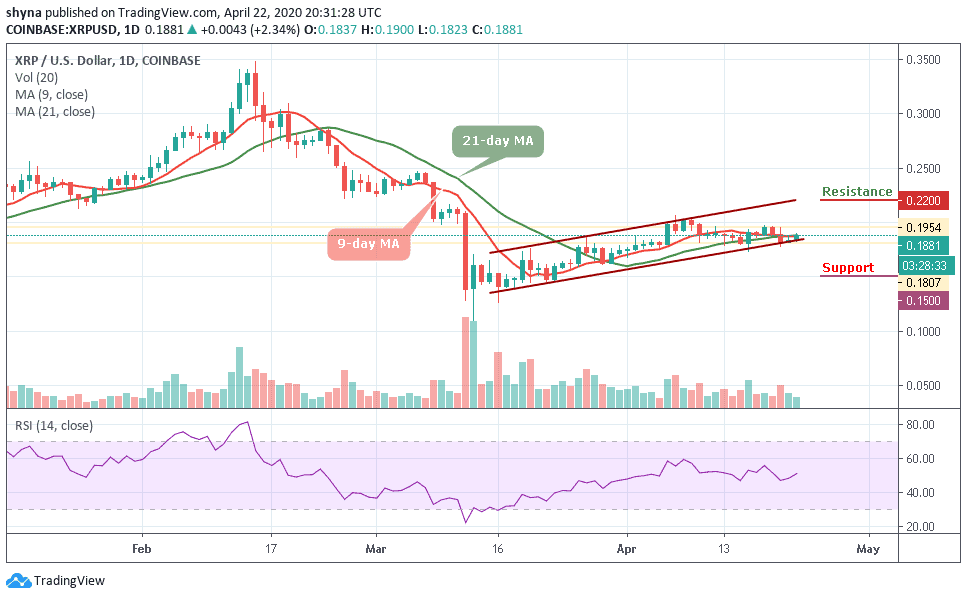
In the meantime, XRP/USD is currently trading at $0.188 as reveals by the daily chart. Buyers intend to hold the price above the 9-day and 21-day moving averages in readiness for more bullish action following the current consolidation period. The crypto asset has been range-bound since the beginning of the week. Meanwhile, the immediate downside is also supported by the ascending trend line.
According to the technical indicator RSI (14), Ripple is currently in the hands of the bulls. However, the coin lacks a catalyst to sustain a breakout above $0.200. Meanwhile, the bulls may remain in control in the coming sessions ahead of a possible breakout in tandem with the bullish cryptocurrency market. However, traders should keep an eye on the $0.200 and $0.210 levels before creating a new bullish trend at the resistance levels of $0.220, $0.230, and $0.240.
However, if the market experiences any slight drop during this movement, it may cross below the lower boundary of the ascending channel to hit the nearest support at $0.160 and a further drop could push the market to $0.150, $0.140 and $0.130 supports. More so, the technical indicator RSI (14) moves above the 50-level, which indicates more bullish signals.
When compared with BTC, the pair is still trading within a symmetrical triangle trading below the 9-day and 21-day moving averages. The Ripple (XRP) is yet to breakdown from the symmetrical triangle. However, from the upside, the nearest levels of resistance lie at 2700 SAT.
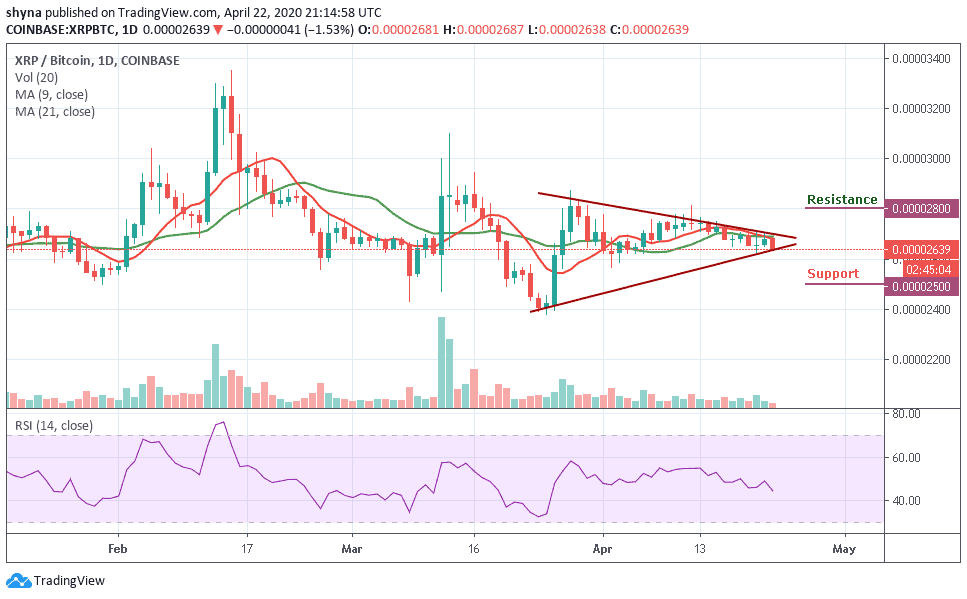
In addition, if the bulls can break above 2700 SAT, further resistance is found at 2800 SAT and above but if the sellers push the price beneath the trend line of the symmetrical triangle, the next level of support is located at 2400 SAT, further support is found at 2500 SAT and below. The RSI (14) is seen moving below 45-level, which indicates more bearish signals.
Please note: Insidebitcoins.com is not a financial advisor. Do your research before investing your funds in any financial asset or presented product or event. We are not responsible for your investing results.
Join Our Telegram channel to stay up to date on breaking news coverage