Join Our Telegram channel to stay up to date on breaking news coverage
XRP Price Analysis – August 27
The XRP falls to trade near its main support area of $0.25. With that, the XRP price comes out of the price loop of $0.27 and drops.
XRP/USD Market
Key Levels:
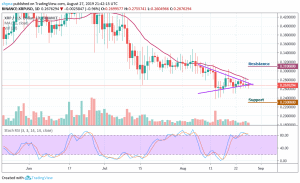
Resistance levels: $0.31, $0.32, $0.33
Support levels: $0.23, $0.22, $0.21
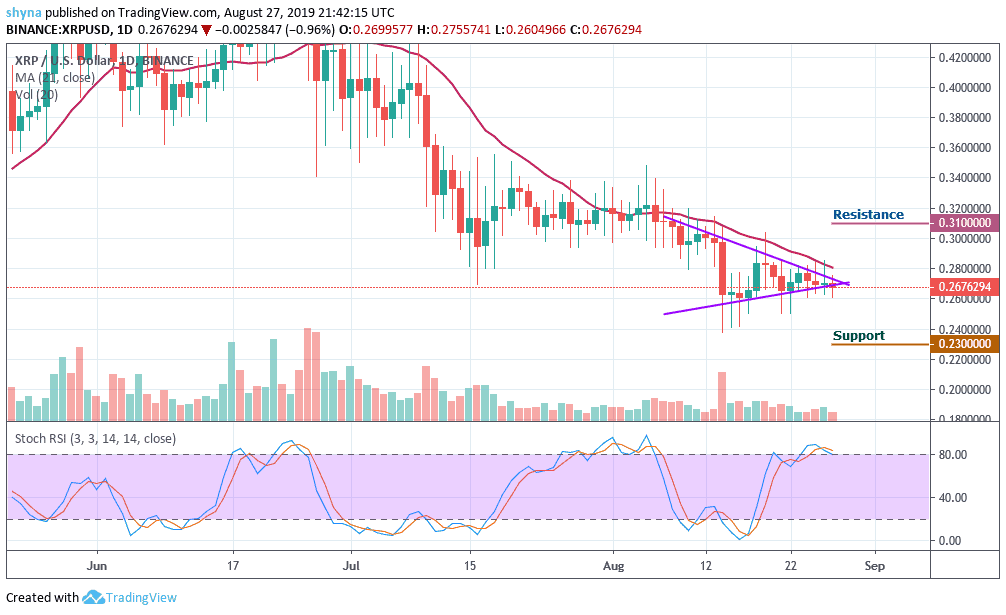
The XRP is currently trading with strong selling pressure and in the overall bearish zone with a weakened force to regain speedily. Yesterday’s trading clearly shows the downward trend of the coin in the early hours. The current price of the coin is well below its 21-day short-term moving average but XRP needs a steady rebound for its uptrend to continue.
However, the market is currently showing a sign of controlling volatility with bullish price action. Looking at the chart, we can see that the trading volume is still low. If the XRP/USD continues to be under bearish control, the price could return to previous supports at $0.23, $0.22 and $0.21 levels. On the upside, we can expect the next resistance level at $0.31, $0.32 and $0.33 while the stochastic RSI is in the overbought zone.
XRP/BTC Market
Against Bitcoin and according to the chart, the bulls are trying to step back into the market by halting the downward trend. For now, XRP/BTC is showing some promising signs that may likely start to make higher highs if it breaks above the 21-day moving average and the upper line of the symmetric triangle.
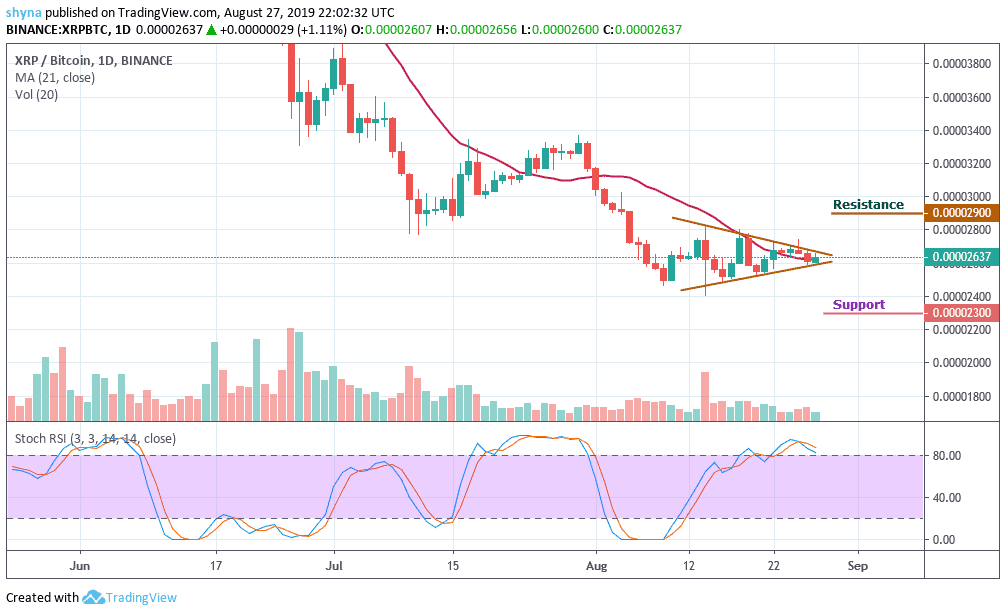
However, looking at it from the upside, the nearest resistance level lies at 2900SAT and above this, higher resistance lies at 3000SAT and 3100SAT. From below; the nearest support levels are 2600SAT and 2500SAT. Beneath 2500SAT, further support lies at 2300SAT. If the price drops further to create a new low, lower support is located at 2200SAT and 2100SAT. The stochastic RSI has managed to break above the 80-level to move into the overbought.
Please note: insidebitcoins.com is not a financial advisor. Do your research before investing your funds in any financial asset or presented product or event. We are not responsible for your investing results.
Join Our Telegram channel to stay up to date on breaking news coverage