Join Our Telegram channel to stay up to date on breaking news coverage
XRP Price Analysis – September 3
If Ripple’s XRP manages to climb above the $0.27, the market may fuel a bull run to $0.30 resistance level and above.
XRP/USD Market
Key Levels:
Resistance levels: $0.30, $0.32, $0.34
Support levels: $0.23, $0.21, $0.19

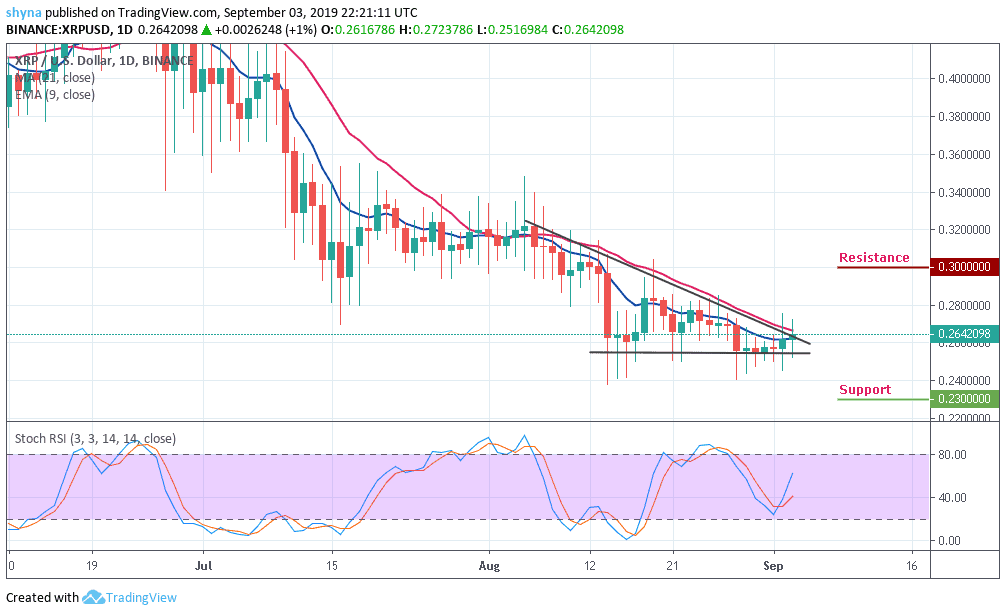
At the time of writing this article, the Ripple price continues to show a strong downtrend on the chart, as well as a decreasing trend line that has served as a diagonal resistance for the market since August 5th. After recovering from the August 28th sell-off, the price action now seeks for a retest at the $0.26 resistance level before returning to support levels of $0.25, $0.24 and $0.23.
However, if Ripple’s XRP manages to climb above the $0.27, the market may fuel a bull run to $0.30, $0.32, $0.34 resistance levels and above. As of now, the bulls appeared to be gaining control on a long-term outlook. Therefore, it might be so difficult for the bears to gain control at the moment. The stochastic RSI is moving towards level 60, indicating more bullish signals.
XRP/BTC Market
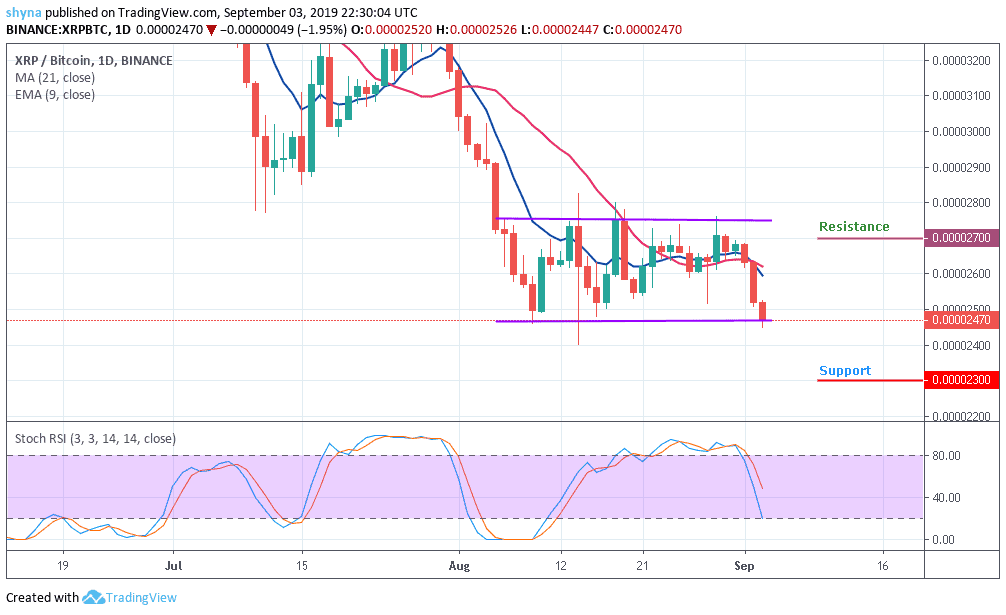
Against Bitcoin, on the daily chart, Ripple (XRP) moves in sideways as the price trades under the 9-day EMA and 21-day MA. Now, the bear appears to be stepping back in the market, and we can expect the price-drop to 2300SAT and 2100SAT support levels. But as at the time of writing, XRP/BTC is changing hands at 2471SAT.

Nevertheless, if the buyers push the price above the current 2471SAT, the next level of resistance is located at 2700SAT and more resistance is found at 2800SAT and 3000SAT. The stochastic RSI faces down as bears introduce more blood into the market.
Please note: Insidebitcoins.com is not a financial advisor. Do your research before investing your funds in any financial asset or presented product or event. We are not responsible for your investing results.
Join Our Telegram channel to stay up to date on breaking news coverage


