Join Our Telegram channel to stay up to date on breaking news coverage
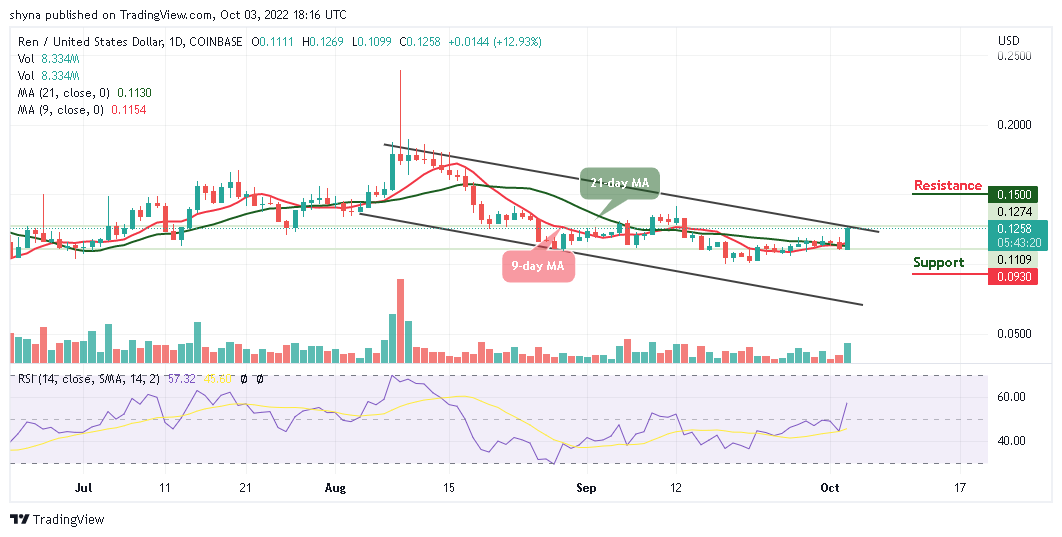
As revealed in the daily chart, The Ren (REN) price prediction breaks out as the price aims for a new high at $0.126.
Ren Prediction Statistics Data:
- Ren price now – $0.125
- Ren market cap – $122.2 million
- Ren circulating supply – 999 million
- Ren total supply – 999.9 million
- Ren Coinmarketcap ranking – #164
REN/USD Market
Key Levels:
Resistance levels: $0.150, $0.160, $0.170
Support levels: $0.0930, $0.0830, $0.0730
Your capital is at risk
REN/USD with all its blazing guns hits another high at $0.126 surging more than 12.93% at the time of writing. More so, as expected, the cryptocurrency has finally given a breakout from its previous monthly high and has now entered price discovery mode. However, the journey has just started for the coin as REN/USD is eyeing the $0.130 level to be its next target.
Ren Price Prediction: Where is Ren Price Going Next?
The Ren price can be expected to rise to $0.130 over the next few days while the ongoing trend may move a little bit above the upper boundary of the channel in the coming days. The Ren price may cross above the channel to touch the nearest resistance at $0.130. Therefore, as the 9-day MA crosses above the 21-day MA, the coin may continue to do well and the price could hit the resistance levels at $0.150, $0.160, and $0.170 respectively.
Meanwhile, REN/USD is currently changing hands at $0.125 amid a building bullish momentum. However, the technical indicator Relative Strength Index (14) also confirms the uptrend as the signal line moves to cross above the 60-level, suggesting more bullish signals but any bearish movement below the moving averages may roll the market down to the support levels of $0.0930, $0.0830, and $0.0730 respectively.
Against Bitcoin, the market price focuses on the bullish movement within the channel as the price trades above the 9-day and 21-day moving averages. REN/BTC is currently trading at 641 SAT and if the market continues to rise, the next key resistance may be at 720 SAT and above.
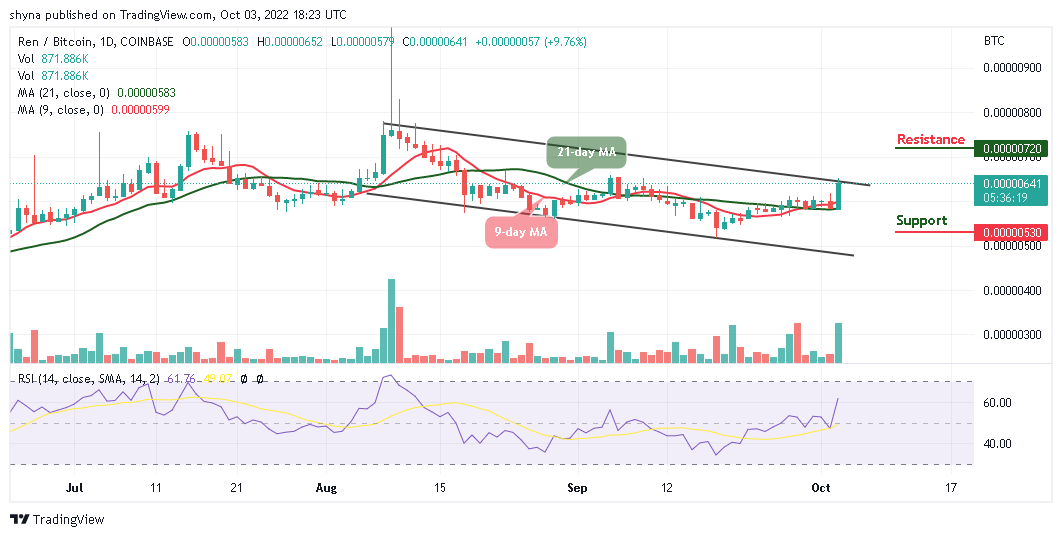
On the contrary, a possible bearish movement below the moving averages may likely come into play, which could lead to the support level of 530 SAT and below. Meanwhile, the market may continue to have a bullish day because the Relative Strength Index (14) indicator crosses above the 60-level, suggesting more bullish signals.
Join Our Telegram channel to stay up to date on breaking news coverage
