Join Our Telegram channel to stay up to date on breaking news coverage
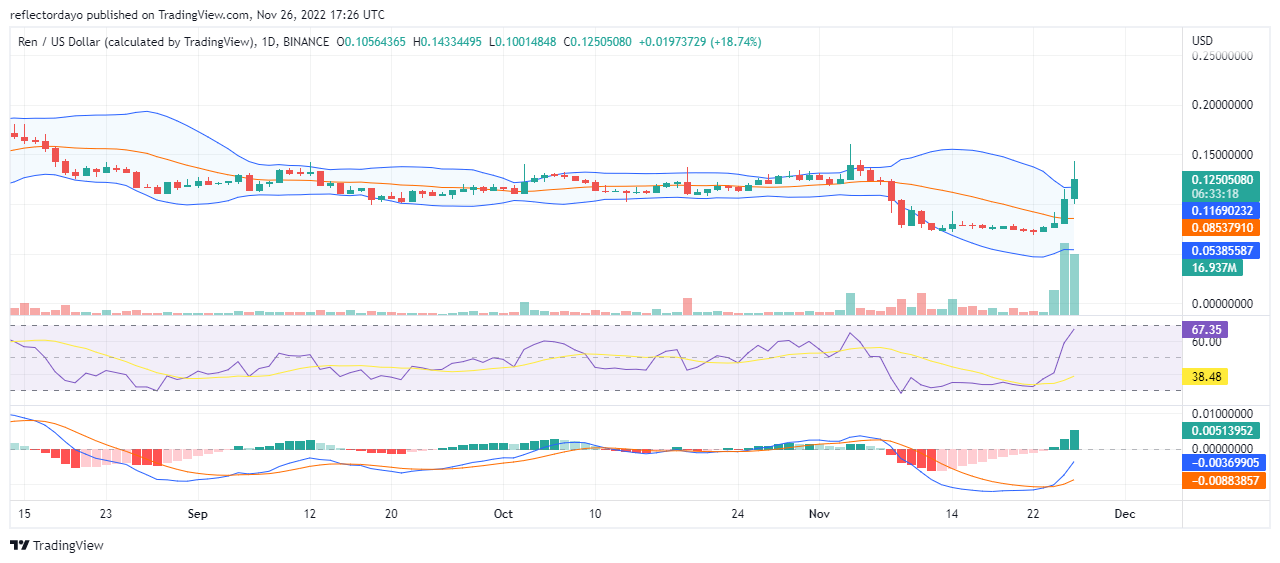
The buyers have taken the market and the bullish price is now testing the $0.139 resistance level. The $0.139 price level was the level at which the Ren market had a bearish price breakout and the price fell below the 20-day moving average. This is another major level that must be captured if the trend must be fully established in favour of the buyers.
Ren Market Price Statistic:
- REN/USD price now: $0.124
- REN/USD market cap: $114,197,727
- REN/USD circulating supply:999,037,500.36
- REN/USD total supply: 1,000,000,000
- REN/USD coin market ranking: #168
Key Levels
- Resistance: $0.1500, $0.1700, $0.1800
- Support: $0.0733, $0.0543, $0.0405
Ren Market Price Analysis: The Indicators’ Point of View
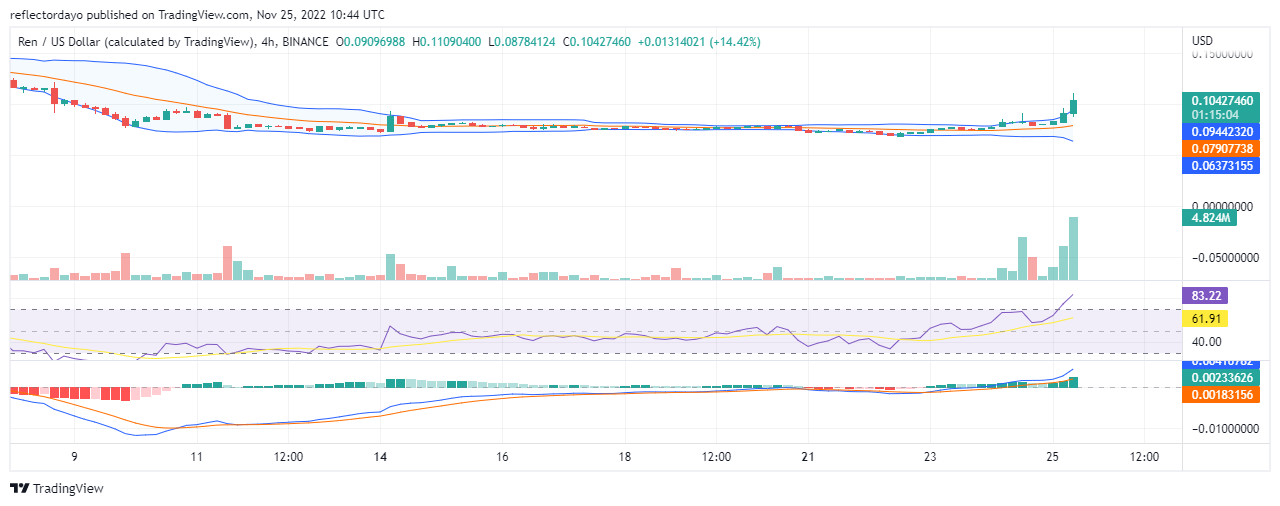
Looking at the Bollinger indicator, the recent bullish move in the market has only been able to change the direction of the bands from a downward movement to a sideway movement. The buyers need to keep up the momentum if the price channel will move upward. With another bullish price in the next trading session, the direction of the Bollinger indicator will change to an upward one. Another indicator that supports this same sentiment is the MACD. The MACD line has crossed the signal line below level zero and it is with a strong velocity. But the lines need to cross out above level zero so that the Ren market can be regarded as a bullish one.
REN/USD 4-Hour Chart Outlook
The Bollinger indicator of the 4-hour outlook only has the upper band and the 20-day moving average responding to the movement of the market. All the components of the Bollinger indicator are expected to move in an upward direction when the bullish trend is established. The trend will be established if the price breaks the resistance level.
After some period of indecision, the Ren market is now taking up a bullish trend. A new platform, now needs to be well-developed to help traders reduce loss. The FTX disaster shows that there is a need for a cutting-edge, innovative platform that can detect disasters that are similar to FTX/FTT, and enable speculators to pinpoint secure trading signals for massive returns. The platform is Dash 2 Trade (D2T), whose presale is currently ongoing. The presale has realized about $7.5 million. D2T affiliate program is also open to all. You can earn your share of the revenue by using the Dash 2 Trade referral links!
Related
Join Our Telegram channel to stay up to date on breaking news coverage
