Join Our Telegram channel to stay up to date on breaking news coverage
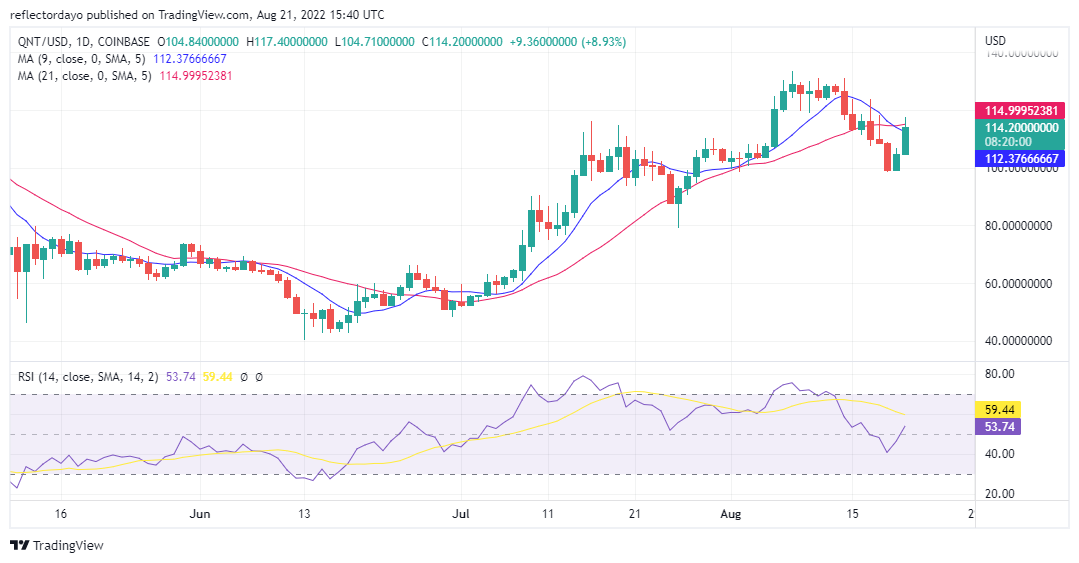
The daily chart of QNT/USD shows a market that is doing fairly well. The market swings are not too bad, but it favours the bulls more than the bears. The market keeps rebounding to favour the bull. In my opinion, this is a healthy investment market. When we look at the 21-day moving average, From early July, we can see that the value of Quant is rising steadily.
Quant Classic Price Statistic Data:
- QNT/USD price now: $113.52
- QNT/USD market cap: $1,367,968,808
- QNT/USD circulating supply: 12,072,738QUANT
- QNT/USD total supply: 14,612,493QUANT
- QNT/USD coin market ranking: #41
Key Levels
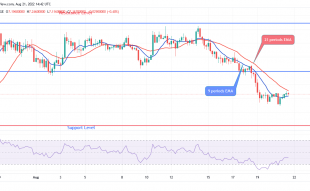
- Resistance: $106.49577390, $128.56917157, $114.17347744
- Support: $99.05799860, $102.41699390, $87.54144330
Your capital is at risk
Quant Price Analysis: QNT/USD Today’s Market Trend
On the 19th of August, there were few or no bullish activities in the market. That day’s market was bearish. Then on the following day, the bulls took the market but not totally as the bears were not relegated in the day’s market. The same thing is happening today. This market behaviour started on the 17th of June till date.
Quant Price Analysis: Information From the Indicators
The signal line of the Relative Strenght Index appears to be on a decline as it currently measures 59.42%. The decline of the signal line was aggravated by the 19th of August, with strong bearish market activities. This strong bearish move was quick to be reflected by the RSI line by measurement of 40% strength. After it had reached this point, the line started to retrace an upper position which is yet to have an observable effect on the slower line. On the MACD indicator, the weak bearish candlestick is on the decline. Although we had bullish activities in the market today and yesterday, the indicator is still pointing to a downtrend. But the downtrend is weakening.
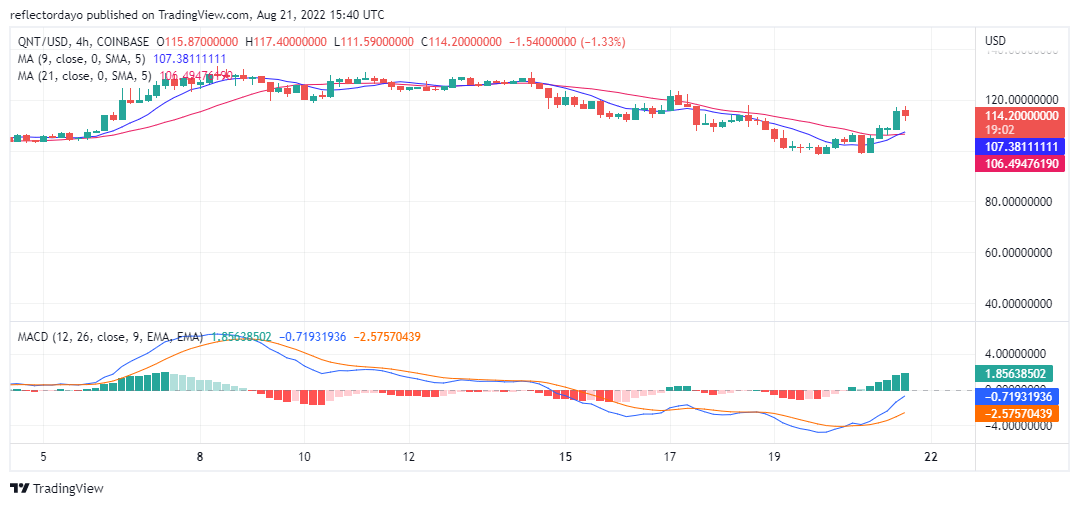
Quant Price Analysis: QNT/USD 4-Hour Chart Outlook
On the 4-hour chart, the trends have changed to an uptrend. The 9-day moving average has retraced an upper position and had crossed the 21-day moving average. This same thing is happening in the MACD indicator. The MACD line has crossed the signal line to indicate that the price is rising. The market may likely continue this trend the price may soon break the $120.000 resistance level.
Related
Join Our Telegram channel to stay up to date on breaking news coverage