Join Our Telegram channel to stay up to date on breaking news coverage
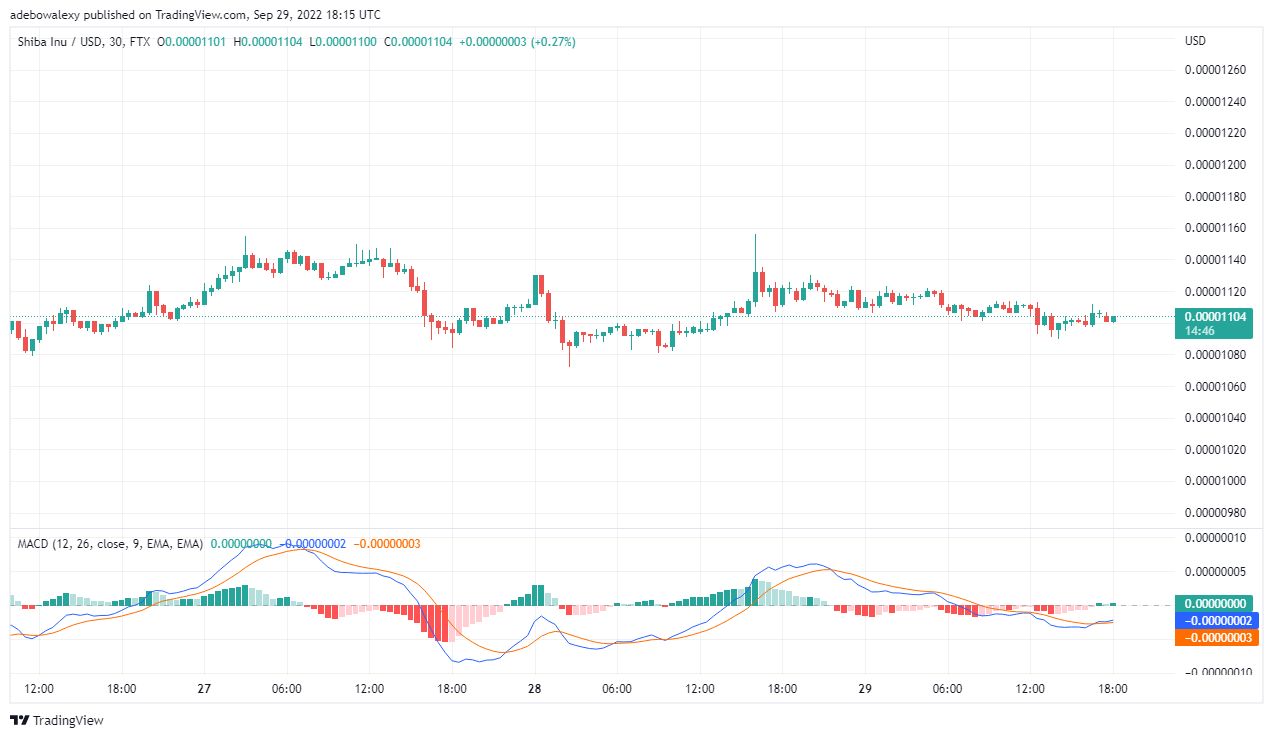
The trading chart for SHIB/USD shows that this it’s price action lacks the strength to break upwards. Also, other technical indicators applied to this market further shows that this pair may have lost the momentum to perform well. Therefore, let’s see what’s left on it for us, shall we?
SHIB Speculation Statistics Data:
Shiba Inu’s current price: is $0.00001101
Shiba Inu’s market cap: $6.1 billion
SHIB’s circulating supply: 549.1 billion
SHIB’s total supply: 589.74 billion
Shiba Inu’s Coinmarketcap ranking: #14
Important Value Marks:
Top Levels: $0.00001125, $0.00001160, $0.00001200
Bottom Levels: $0.00001101, $0.00000980, $0.00000950
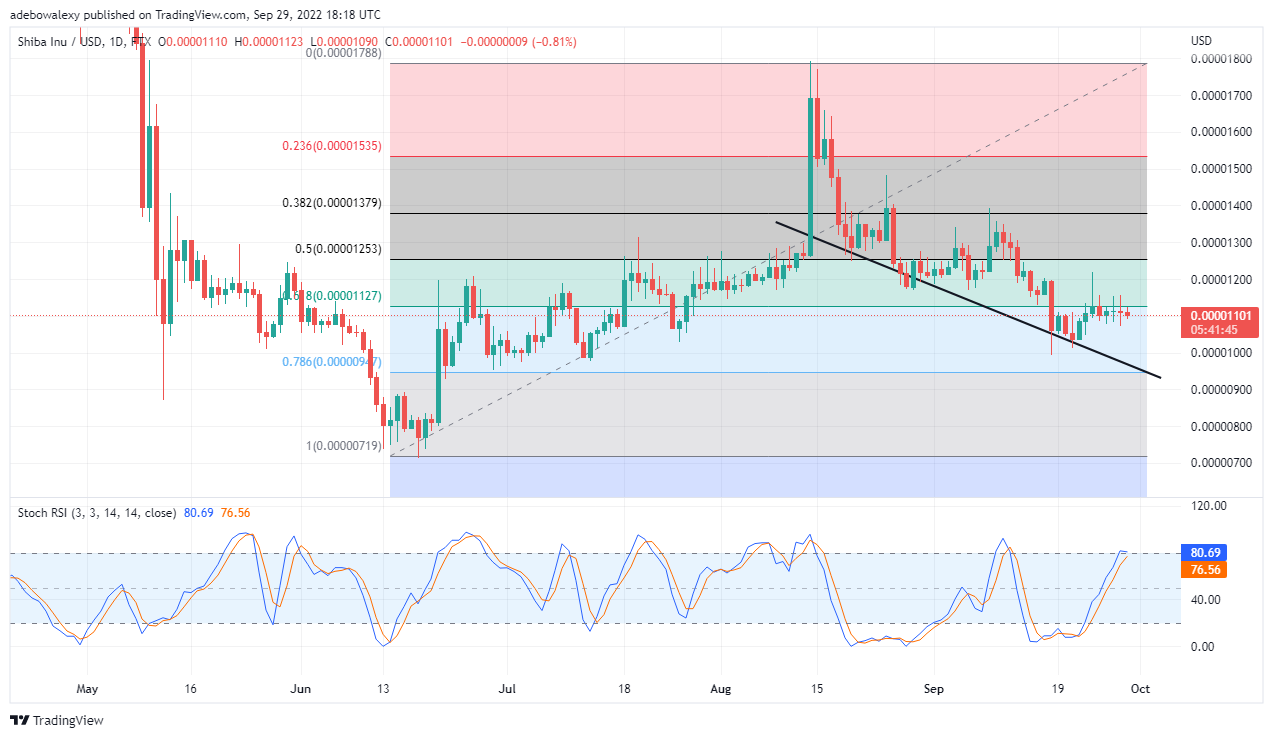
Price Analysis for Shiba Inu: SHIB/USD Unable to Break the Fib Level 61.80
On the SHIB/USD daily chart trading indicators shows that price action lacks the upward momentum to break up the price level of $0.00001127. Also, this price level aligns with the 61.80 fib level, and as such it appears as if the price has found strong resistance at this level. Additionally, the Stochastic RSI further indicates that price action will retrace to the downside. This could be perceived as the terminal of the faster RSI line taking a sharp bend towards the slower one at the 81% level. Summing up the signs in this market traders can anticipate a continuation of the long-term downtrend. Consequently, this may see the price eventually falling to the 78.60 Fib level of price $0.000009470.
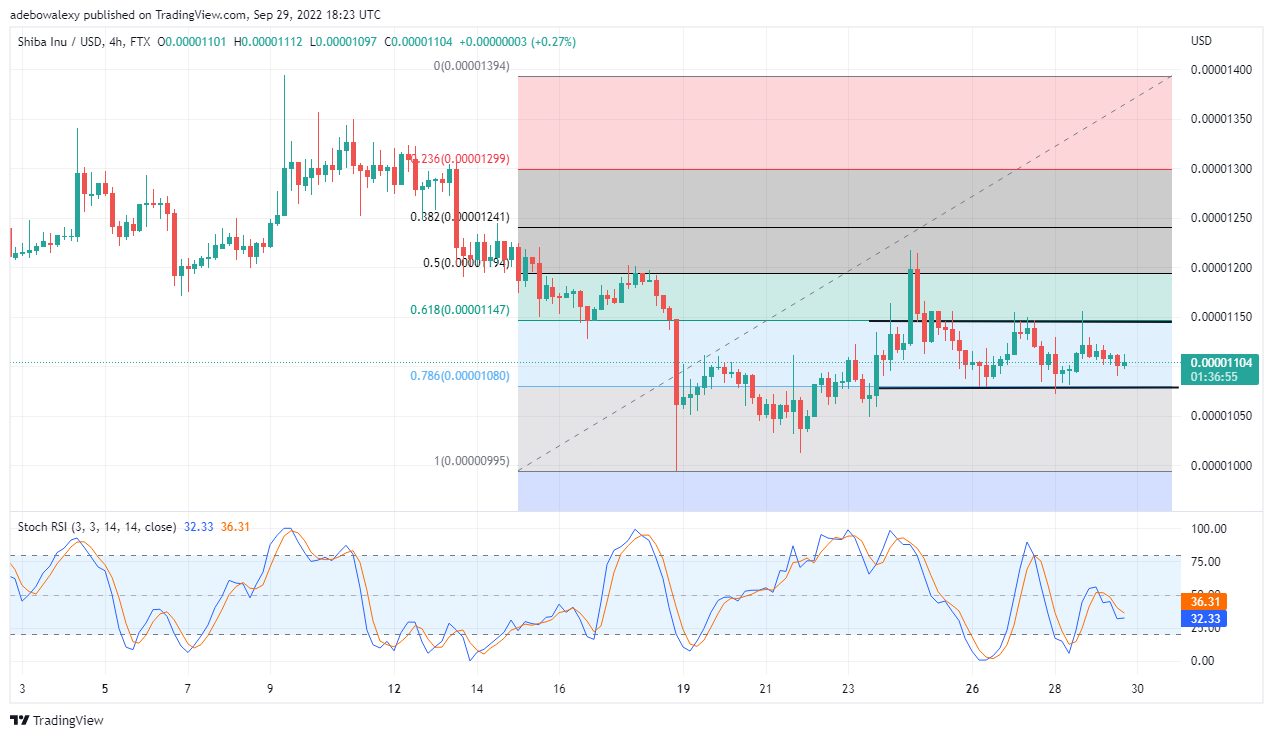
Price Analysis for Shiba Inu: SHIB/USD Is Ranging Sideways
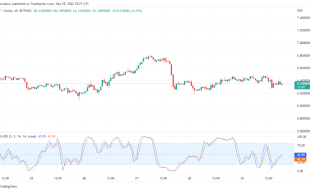
Price activities on the SHIB/USD 4-hour chart reveal that this crypto may consolidate between Fib levels 61.80 and 78.6. The two mentioned fib levels have been tested without being broken. At the present price, action has arrived at the middle of the sideways price channel. The last candle here is bullish, and at that price may experience a upwards pullback here.
Your capital is at risk.
Additionally, the price lines of the Stochastic RSI while moving to the oversold appears to be initiating an uptrend. If Buyers continue to mount buying pressure, there may be an upward correction from here. However, this buying pressure must be very strong if the resistance will be broken upside.Else,price action will only range, and the long term downtrend will eventually resume Consequently, traders who whishes to catch an uptrend, can place a pending buy just above the 61.80 Fibonacci level. This will ensure that price action would ensure that price action may have found support above the 61.80 Fib level.
Join Our Telegram channel to stay up to date on breaking news coverage