Join Our Telegram channel to stay up to date on breaking news coverage
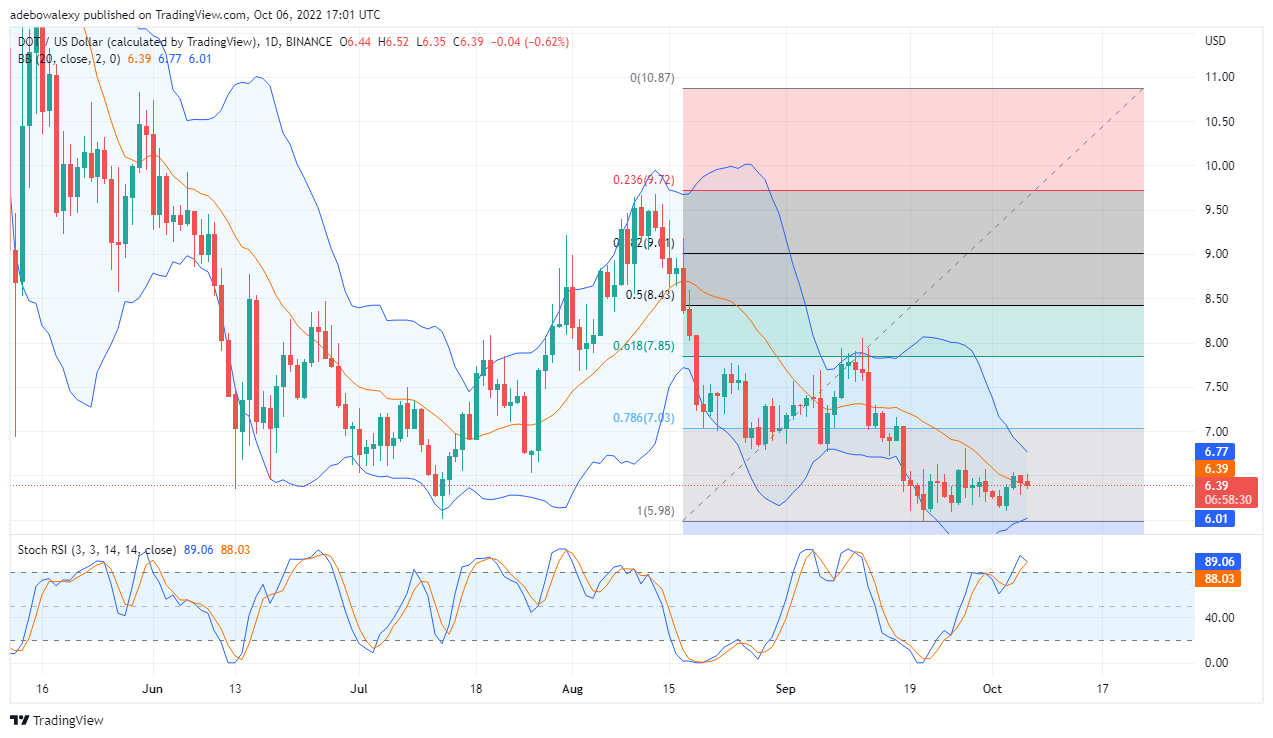
Polkadot Price action has been trading sideways between the Fibonacci level of 78.60 and 100. This consolidation period started around the 19th of last month (September). Currently, price activity in this market appears to be pulling back to the downside.
Polkadot’s Analysis Statistics Data:
DOT’s value now: $6.40
Polkadot’s market cap: $7.2 billion
DOT’s moving supply: 1.12 billion
Total supply of Polkadot: 1.23 billion
DOT’s Coinmarketcap ranking: #12
In this analysis, we will be taking a closer look at price action. This will be done to understand the likely occurrence that will happen soon in this market. Also, the DOT/BTC market will be analyzed too for the sake of traders in this market.
Major Value Marks:
Resistance Levels: $6.70, $7.00, $7.20
Support Levels: $6.40, $6.20, $6.00
Polkadot Price Prediction Today October 7, 2022: Downward Forces Acting On DOT/USD Price
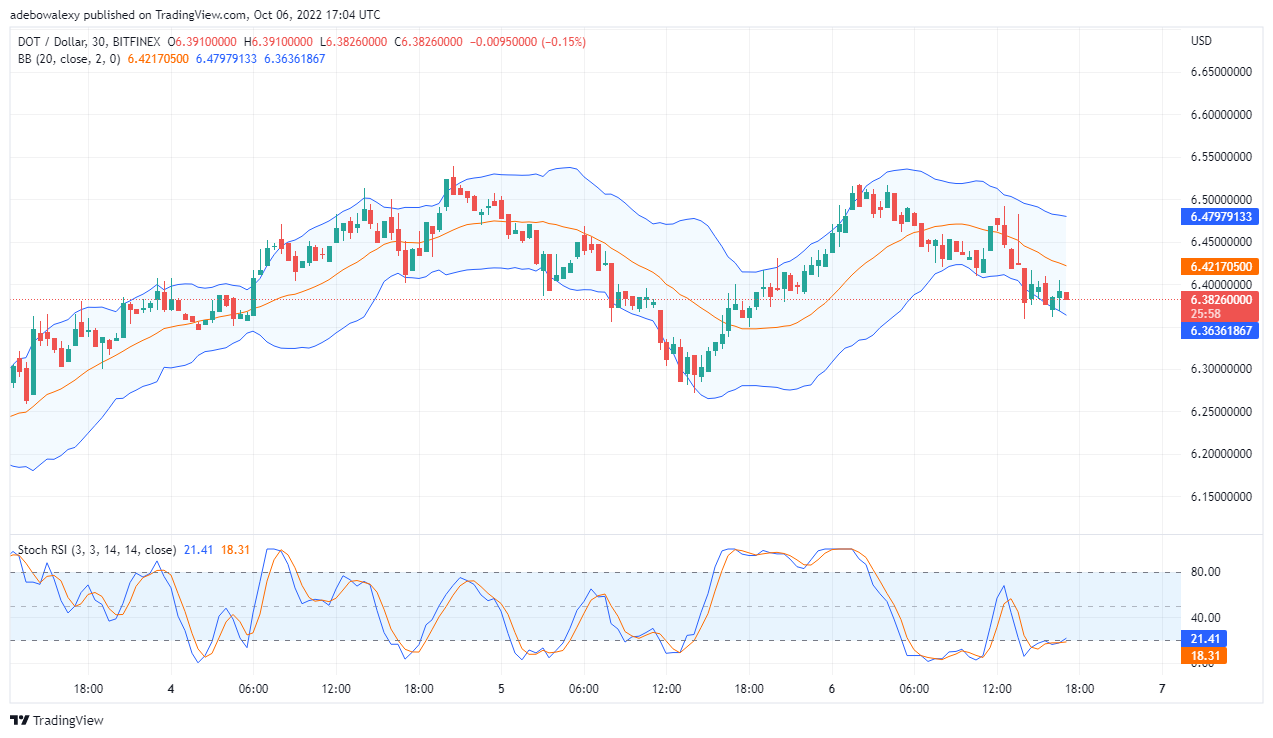
Following a moderate upside gain in the DOT/USD market, downside forces soon resumed activities. Consequently, this has started a downward pullback in price movements. Currently, price action is now at the same level as the mid-limit of the Bollinger indicator. Furthermore, The RSI lines are now touching each other at their terminals. By implication, this is portraying the activities of the bears, as they are trying to pull prices downwards. At this point, is more likely that the price will continue downward. Nevertheless, if buyers can regain control, price action will advance to the upside. The best approach to this situation is to place a pending order (long or short) close to the last candlestick here. However traders can anticipate Polkadot’s price action to fall to $6.10.
Polkadot Price Prediction Today October 7, 2022: DOT/BTC Broke a Support to the Downside
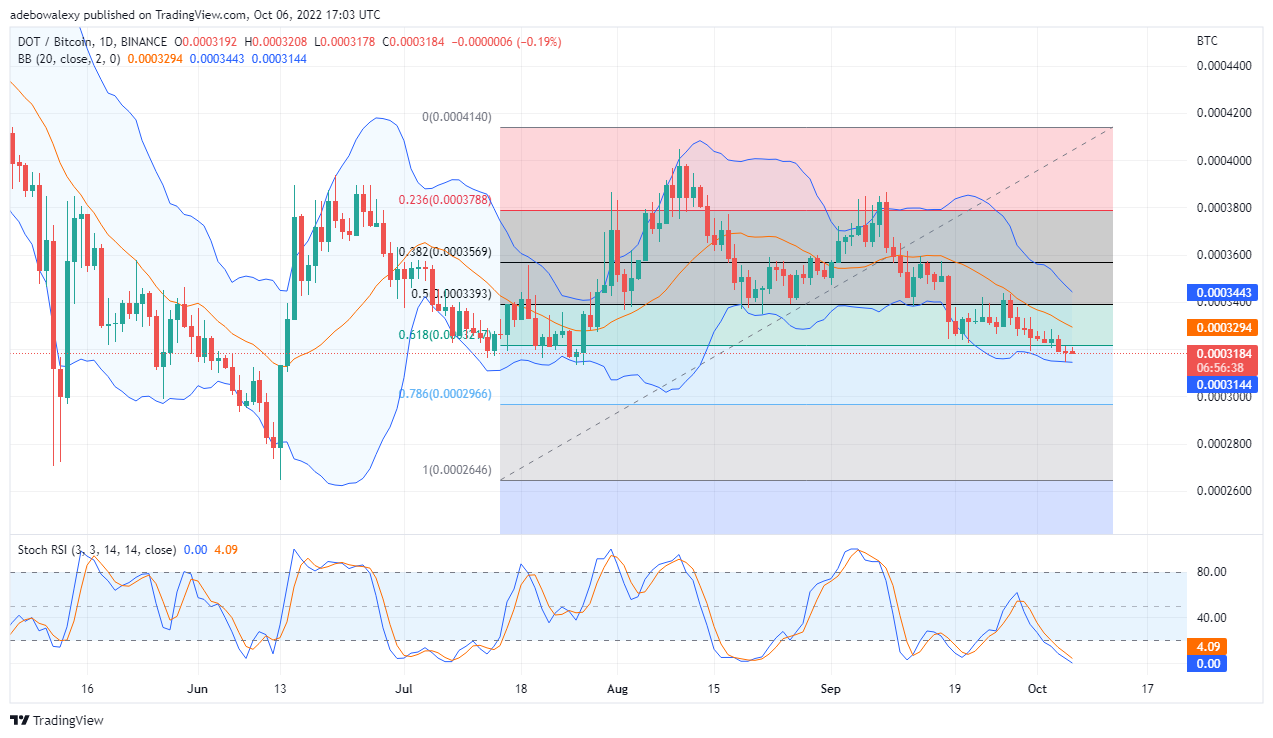
The DOT/BTC price activity failed to find support at the Fibonacci level of 61.80. Subsequently, price activity is now testing the lower band of the Bollinger Indicator. Although, the last candle here still formed in favor of the bears. However, it is logical to anticipate a reversal at the lowest limit of the Bollinger indicator, once it is significantly pushed.
Your capital is at risk.
Moving on, the Stochastic RSI has now reached far into the oversold, with the faster line reaching the 0.00% level already. Very soon the two lines of this indicator will soon converge at the oversold. Be that as it may, the question of if an uptrend will result or not from here solely depends on the dip buyers. Therefore, traders will have to wait to see if a bullish crossover will occur at the oversold. And, if the crossover happens, then a long order can be placed a bit above 0.0003217.
Join Our Telegram channel to stay up to date on breaking news coverage
