
Join Our Telegram channel to stay up to date on breaking news coverage
The Polkadot price prediction manages to maintain its position as the bulls move to push the coin above the moving averages.
Polkadot Prediction Statistics Data:
- Polkadot price now – $5.32
- Polkadot market cap – $6 billion
- Polkadot circulating supply – 1.1 billion
- Polkadot total supply – 1.2 billion
- Polkadot Coinmarketcap ranking – #11
DOT/USD Market
Key Levels:
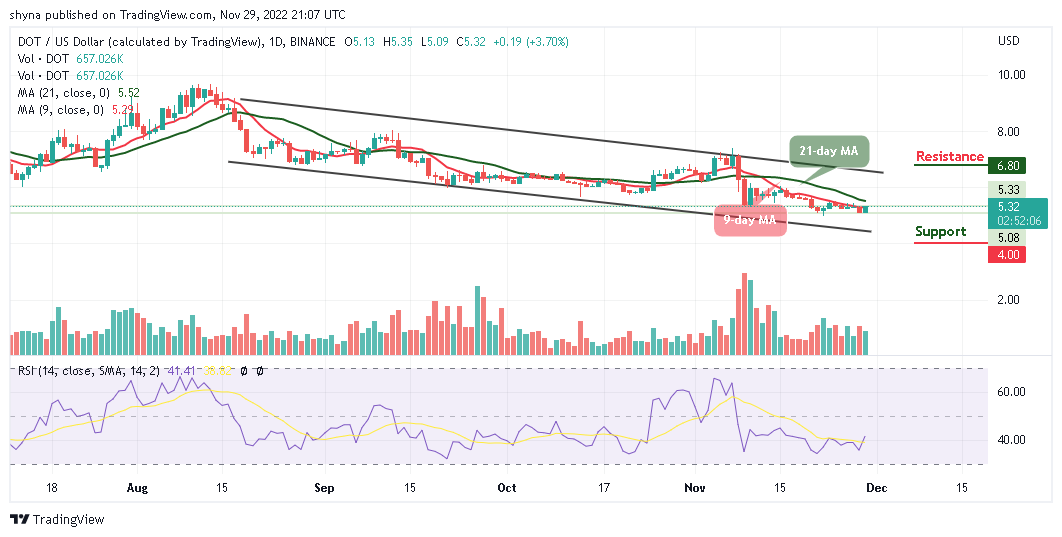
Resistance levels: $6.80, $7.00, $7.20
Support levels: $4.00, $3.80, $3.60
DOT/USD undergoes a much-needed break to the positive side as the market opens today. The Polkadot price is currently posting gains of over 3.70% within the chart, with the coin aiming to cross above the 9-day and 21-day moving averages at $5.32.
Polkadot Price Prediction: Polkadot (DOT) Ready for the Upside
The Polkadot price resumes back in the middle of consolidation after a slight drop below the 9-day and 21-day moving averages. In the meantime, if the market price continues the surge and moves toward the upper boundary of the channel, the $5.5 resistance level is likely to come to play and the Polkadot price may look for higher price levels if the bulls show commitment.
At the time of writing, the market displays a sign of subduing volatility with choppy price action. If the Polkadot price decides to stay under the control of bears, the price may roll back to the previous supports at $4.00, $3.80, and $3.60 below the moving averages. But on the upside, traders can expect the next levels of resistance at $6.80, $7.00, and $7.20. In addition, the technical indicator Relative Strength Index (14) is moving above the 40-level, which indicates that a bullish movement may play out.
Against Bitcoin, the Polkadot price is seen crossing above the 9-day moving average in other to reach the nearest resistance at 3300 SAT. Unless the coin crosses above the 21-day moving average and the price ends up closing above it, there might not be any reason to expect a long-term bullish reversal.
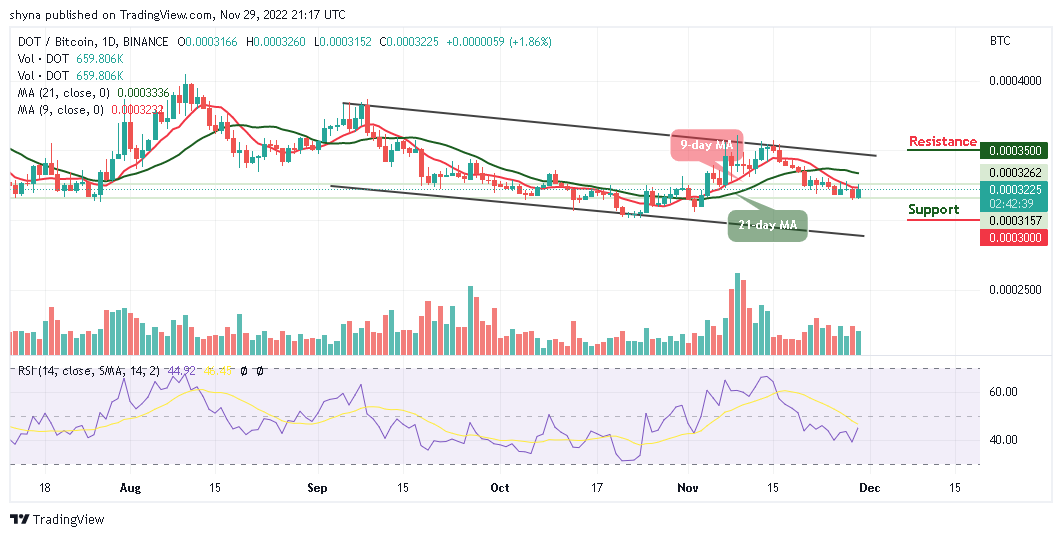
However, staying below the moving averages could refresh lows under 3000 SAT, and a possible bearish movement may likely hit the critical support at 3000 SAT and below while the buyers may push the coin to the potential resistance level of 3500 SAT and above as the technical indicator Relative Strength Index (14) remains above 40-level, suggesting more bullish signals.
Whereas, the IMPT presale is still live on their official website, and it has raised almost $13.5 million. This project makes everybody partake and assist the planet in a cool and efficient manner. Do not miss this attractive offer. You can also join their Discord channel.
However, the FTX disaster shows that there is a need for a cutting-edge, innovative platform that can detect disasters that are similar to FTX/FTT, and enable speculators to pinpoint secure trading signals for massive returns. The platform is Dash 2 Trade (D2T), whose presale is currently ongoing. The presale has realized about $7.5 million. The D2T affiliate program is also open to all. You can earn your share of the revenue by using the Dash 2 Trade referral links!
Related
Join Our Telegram channel to stay up to date on breaking news coverage