Join Our Telegram channel to stay up to date on breaking news coverage
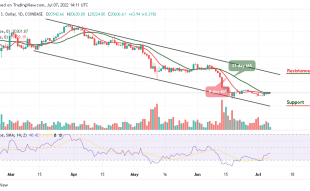
According to the daily chart, the Polkadot price prediction shows that DOT is likely to move consistently within the channel.
Polkadot Prediction Statistics Data:
- Polkadot price now – $7.12
- Polkadot market cap – $7.0 billion
- Polkadot circulating supply – 987.5 million
- Polkadot total supply – 1.1 billion
- Polkadot Coinmarketcap ranking – #11
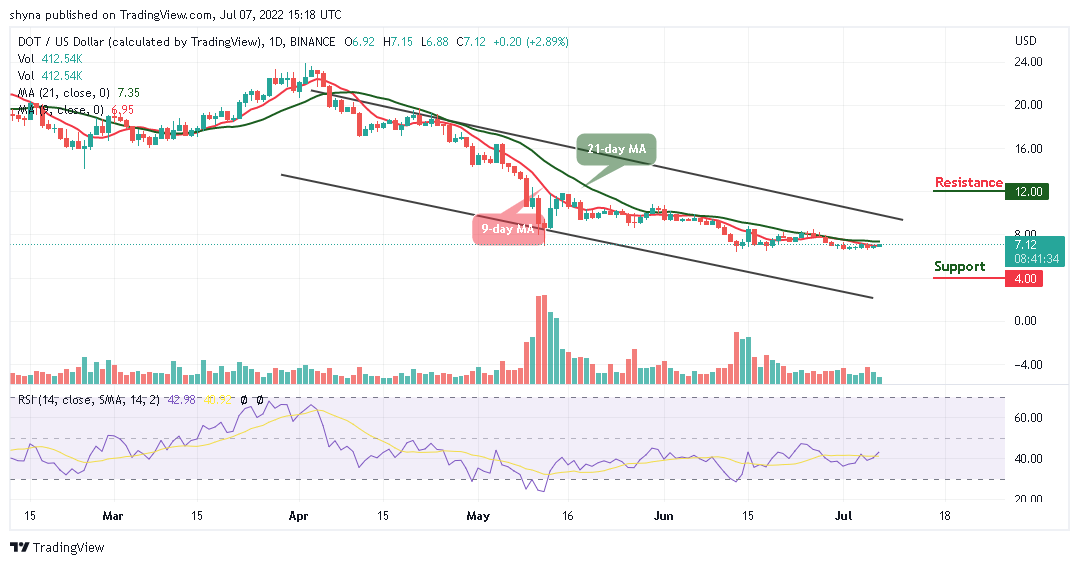
DOT/USD Market
Key Levels:
Resistance levels: $12, $14, $16
Support levels: $4, $3, $2
DOT/USD is moving to cross above the 9-day and 21-day moving averages. In the last few days, the Polkadot price continues to move sideways as the coin prepares for the upside However, the technical indicator Relative Strength Index (14) is hovering above the 40-level, confirming the slight bullish movement in the market.
Polkadot Price Prediction: Would DOT Price Move to the Upside?
As the daily chart reveals, the Polkadot price is currently moving toward the 21-day moving average, and if the coin continues with the bullish movement, the bulls may head towards the upper boundary of the channel where it could hit the resistance levels of $12, $14, and $16.
On the contrary, if the coin slide below the 9-day and 21-day moving averages, it could return the coin to the support levels of $4, $3, and $2 respectively. Meanwhile, the long-term buyers should not be bothered by the small impact on the road, as the future of DOT is assured as revealed by the technical indicator Relative Strength Index (14).
DOT/BTC Market: Price May Keep Moving Sideways
Against Bitcoin, the Polkadot price is hovering below the 9-day and 21-day moving averages. The technical indicator Relative Strength index (14) is likely to remain below the 50-level, which may soon increase the bullish movement. However, a possible rise may surface once the technical indicator crosses above the 50-level, and this may cause the coin to hit the resistance level of 4500 SAT and above.
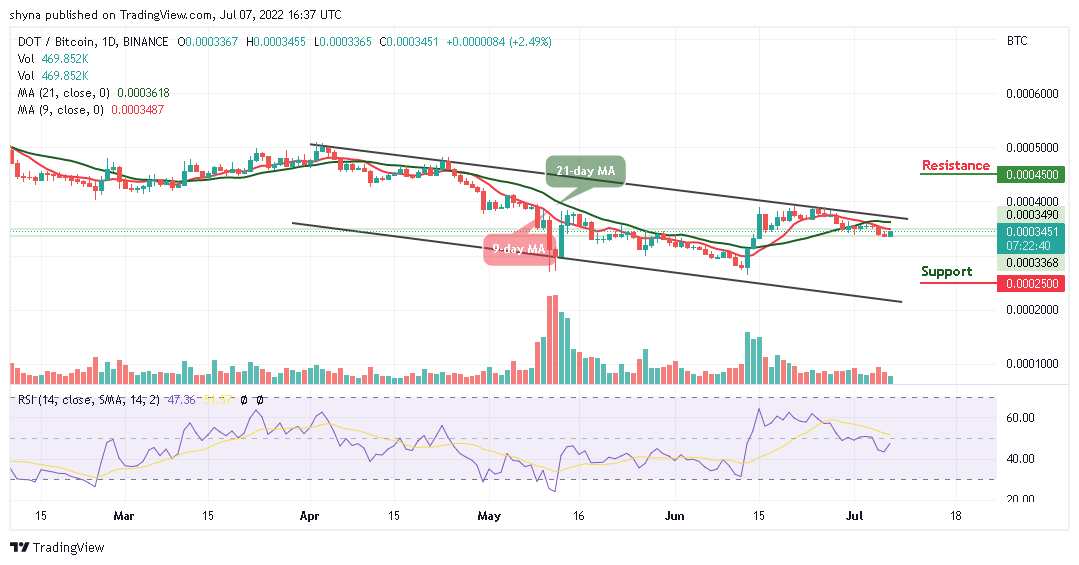
Meanwhile, any bearish movement towards the south could bring the coin to the support level of 2500 SAT and below. However, breaking to the upside may take it to a new high.
Read more:
Join Our Telegram channel to stay up to date on breaking news coverage