Join Our Telegram channel to stay up to date on breaking news coverage
Polkadot (DOT) is showing early signs of a potential recovery, with its price stabilizing near key resistance levels. As technical indicators hint at waning selling pressure, traders are closely watching for a breakout that could push DOT toward the $7 mark. With strong fundamentals and an evolving ecosystem, could this be the beginning of a sustained upward trend for DOT?
DOT Key Statistics
- Current Price: $5.13
- Market Cap: $7.96
- Trading Volume (24h): $424.9 million
- Circulating Supply: 1.55 billion DOT
- Total Supply: 1.55 billion DOT
- CoinMarketCap Ranking: #21
Polkadot (DOT) is currently trading 32.28% lower than its highest price over the past 30 days and 1.38% below its peak from the last 7 days. On the other hand, it has gained 28.07% from its lowest point in the past month and 15.02% from its 7-day low.
DOT/USD Market
Key Levels
- Resistance: $5.33, $6.56, $7.00
- Support: $4.10, $3.67, $3.00
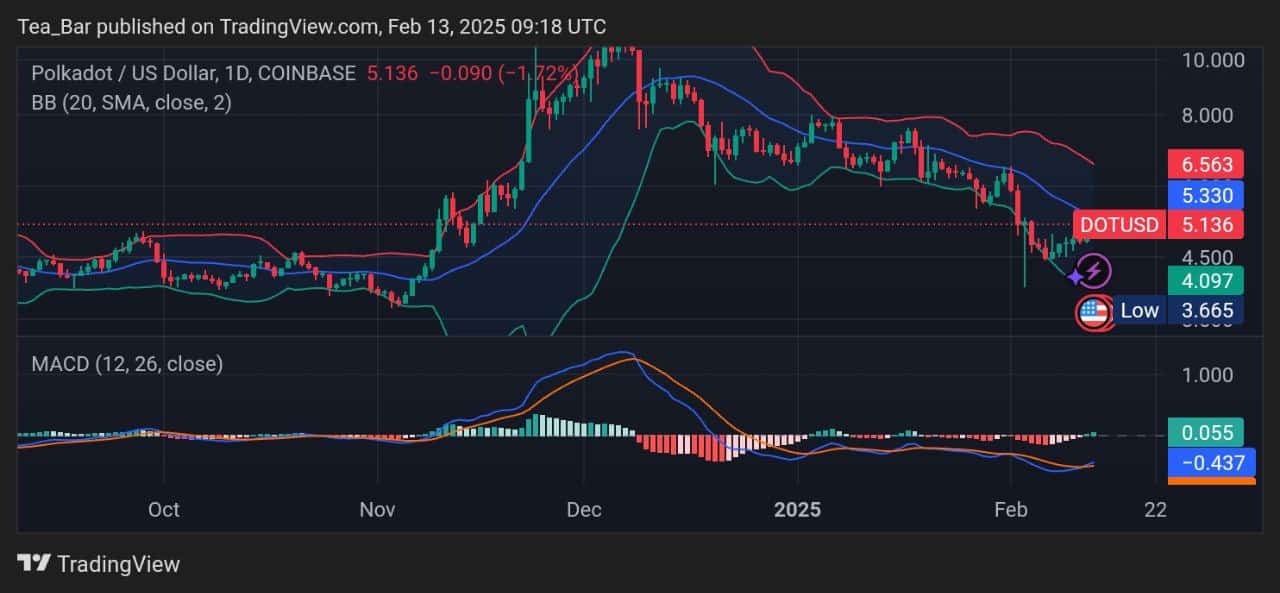
Polkadot (DOT) is currently showing signs of a potential recovery, trading at $5.13 while testing resistance near the middle Bollinger Band. The MACD histogram is gradually turning green, indicating that selling pressure may be weakening. If bullish momentum builds, DOT could push past the $5.33 resistance level, with further upside potential toward $6.56. A breakout above this key area could shift market sentiment, opening the path for a rally toward $7.00. However, DOT needs strong volume confirmation to sustain any upward move.
On the downside, immediate support lies at $4.10, where previous buying activity was observed. If this level fails, DOT could drop toward $3.67, its recent swing low. A further decline could expose the price to $3.00, a critical support zone where buyers may step in aggressively. While the MACD signals early bullish divergence, DOT must decisively reclaim key resistance levels to confirm a trend reversal. Traders should watch for a breakout or a rejection at these levels to gauge the next major price movement.
Can Polkadot (DOT) Regain Momentum and Push Toward $7.00?
Polkadot (DOT) is showing signs of renewed bullish momentum, with technical indicators hinting at a possible retest of the $7 resistance level. If buying pressure continues to build, DOT could break through key resistance zones, supported by increased trading volume and improving market sentiment. A sustained move above current levels would likely attract more investors, potentially triggering a rally toward the psychological $7 mark. However, maintaining this upward trajectory will depend on broader market conditions and whether DOT can hold above its immediate support levels.
Polkadot (DOT) Price: More Technical Insights
Fundamentally, Polkadot remains a strong contender in the blockchain space, thanks to its innovative parachain technology, which enhances scalability and interoperability. Recent developments, such as network upgrades and increased developer activity, have strengthened its ecosystem, fostering greater adoption. Moreover, DOT’s role in staking and governance ensures continuous engagement from the community, further solidifying its long-term potential. With these factors in play, could DOT’s fundamentals provide the necessary support for a sustained price recovery toward $7?
DOT/BTC Performance Insight
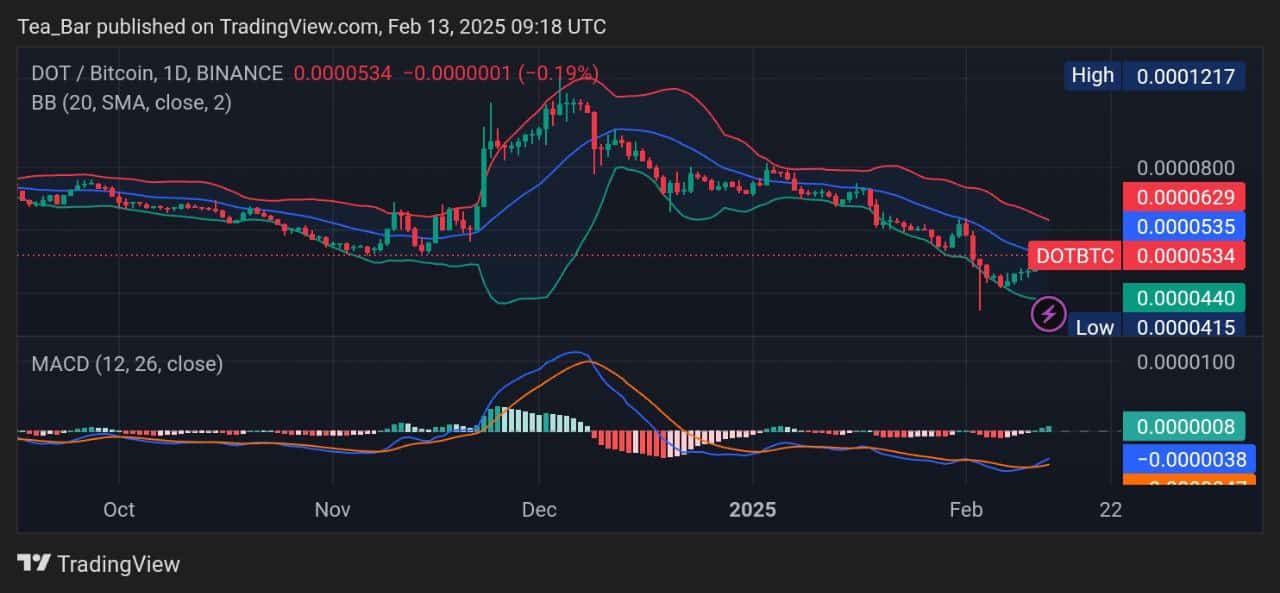
The DOT/BTC daily chart shows a prolonged downtrend, with the price currently at 0.0000534 BTC, slightly below the middle Bollinger Band. The Bollinger Bands are still wide, indicating volatility, though a recent bounce from the 0.0000415 BTC low suggests a potential reversal attempt. The MACD remains in bearish territory, but the histogram is showing signs of reducing selling pressure. For a confirmed bullish shift, DOT/BTC needs to break above 0.0000535 BTC, the middle Bollinger Band, and sustain momentum toward the 0.0000629 BTC resistance. A drop below 0.0000440 BTC support could extend the downward movement.
Popular analyst Ali Martinez pointed out that Polkadot (DOT) has recently made a notable U-turn in its price movement, signaling a potential change in trend. This shift has sparked discussions within the crypto community about whether DOT’s reversal could be an early indicator of a broader market recovery. Given that major altcoins often move in correlation with Bitcoin and overall market sentiment, Martinez’s observation raises the question of whether other cryptocurrencies might soon follow a similar pattern.
#Polkadot $DOT just did a U-turn! Should we expect the same for the rest of the market? pic.twitter.com/LacdptFMBW
— Ali (@ali_charts) February 12, 2025
Alternatives to Polkadot
Polkadot continues to assert itself as a leader in blockchain innovation, leveraging its pioneering parachain architecture to address scalability and foster cross-chain connectivity. Yet the emergence of disruptors like Wall Street Pepe ($WEPE) underscores the industry’s dynamic evolution, where novel concepts disrupt conventions and unlock untapped potential.
Wall Street Pepe has rapidly gained momentum, securing over $70 million in its presale—a clear indicator of market excitement for its hybrid approach. The initiative blends the viral appeal of meme-driven tokens with a structured, utility-focused ecosystem designed to prioritize community empowerment. At its core lies an ambition to democratize finance for everyday investors via an accessible trading platform. This ecosystem emphasizes education, collaborative tools, and shared resources, cultivating an environment where members can learn, engage, and prosper together.
WEPE Claim Day Goes Live
$WEPE’s token distribution further underscores its dedication to sustainability and transparency: 20% fuels the FROG Fund (driving strategic growth), 12% rewards staking participation (encouraging committed holders), and 38% powers aggressive marketing (expanding global visibility). This framework balances immediate engagement with forward-thinking development. As the crypto sector matures, Wall Street Pepe’s unique integration of meme virality, community-driven governance, and clear economic incentives positions it to reshape investor engagement. By uniting lighthearted culture with actionable utility, the project champions a vision where decentralized finance becomes both inclusive and impactful—inviting participants to join a transformative wave in the blockchain arena.
Related News
- Polkadot Price Prediction: DOT Pumps 55% In A Week, But Experts Say This Might Be The Best Crypto To Buy Now
- Wall Street Pepe Presale Ends Early After WEPE Tokens Soak Up More Than $73M – Listing Soon
Newest Meme Coin ICO - Wall Street Pepe
- Audited By Coinsult
- Early Access Presale Round
- Private Trading Alpha For $WEPE Army
- Staking Pool - High Dynamic APY
Join Our Telegram channel to stay up to date on breaking news coverage