Join Our Telegram channel to stay up to date on breaking news coverage
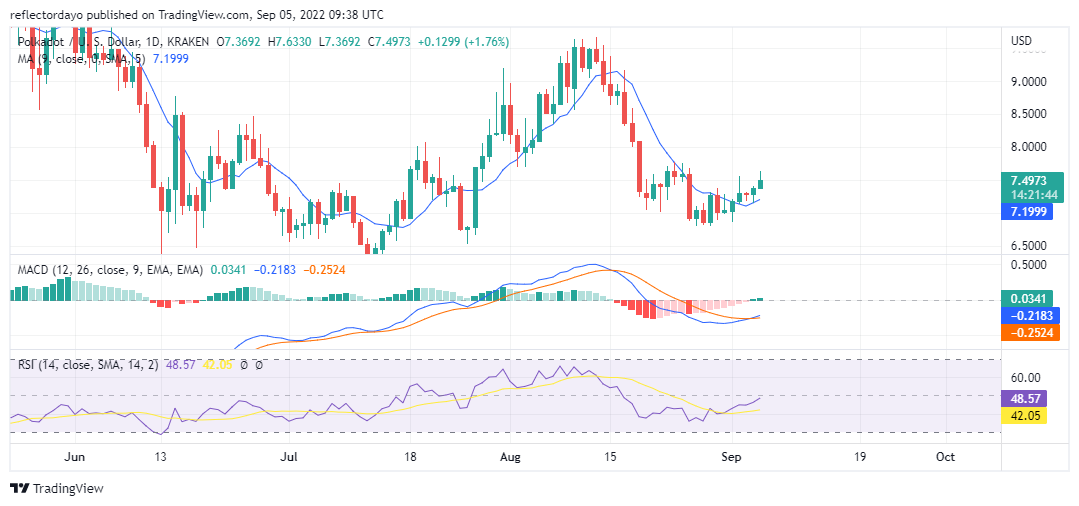
The bullish engulfing pattern candlesticks of Polkadot that appear on the 29th of August, at the support level of $6.8122, signal the end of the downtrend. Although the following day – the 30th of August was very bearish, this did not stop the expended trend as buyers regained the market on the next day. As the market price swings high, we cannot ignore the fact that the selling pressure is still considerably high. It is just that the buyers are stronger than the Sellers
Polkadot Market Price Statistic:
- DOT /USD price now: $7.4763
- DOT /USD market cap: $ 8,325,367,635
- DOT /USD circulating supply: 1,110,000,000
- DOT /USD total supply: 1,229,047,682
- DOT /USD coin market ranking: #10
Key Levels
- Resistance: $7.7545, $8.0000, $8.2864
- Support: $7.1466, $7.0402, $6.7362
Your capital is at risk
Polkadot Market Price Analysis: The Indicators’ Point of View
According to the Moving Average Convergence and Divergence indicator, the bearish trend started weakening on the 21st of August. Towards the end of the month, buyers were able to start pushing the market up, despite strong resistance from the sellers. The histogram that represents the market for yesterday and today is greenish. Although the histogram is very small, they portray buyers’ strength. The Relative Strength Index still has its measurement in the lower region. The indicator measuring market strength is around 45%. However, the market will likely continue to trend higher.
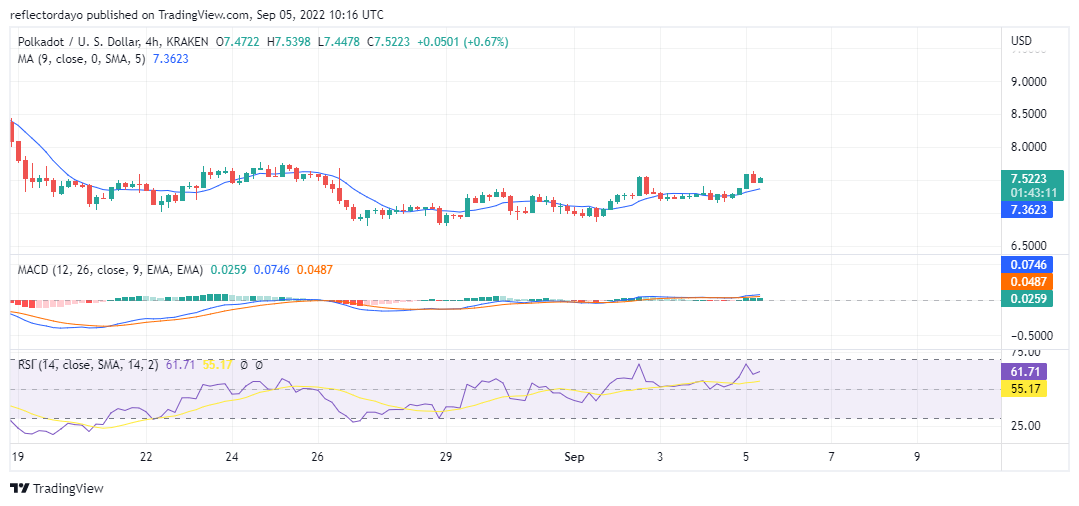
Polkadot: DOT/USD 4-Hour Chart Outlook
At the opening of today’s market bulls takes full control of that session. But they did not make much progress in the second session before the sellers kick them out. Now, in the third session, we are yet to see many impressive moves from the buyers. Nevertheless, all the indicators are showing positive signs for the continuation of the trend.
Related
Join Our Telegram channel to stay up to date on breaking news coverage