Join Our Telegram channel to stay up to date on breaking news coverage
Polkadot is pulling back
DOTUSD Price Analysis – August 16
Polkadot may continue the bullish movement provided the resistance level at $9.1 does not hold and it may increase to $9.6 and $10.3 price level. In case the bears oppose the bulls, the price may decrease to the support level of $8.6, $8.3 and $7.6.
DOT/USD Market
Key levels:
Resistance levels: $9.1, $9.6, $10.3
Support levels: $8.6, $8.3, $7.6
DOTUSD Long-term Trend: Bullish
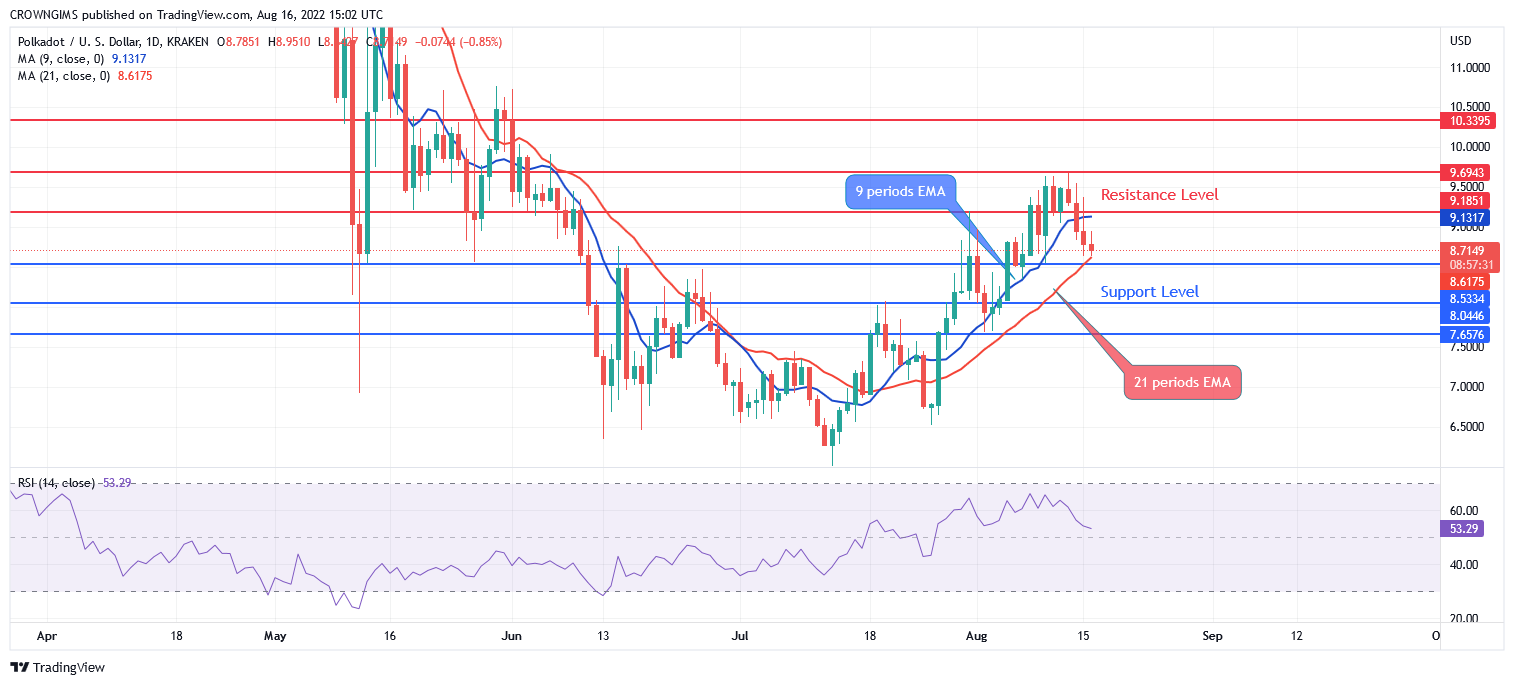
DOTUSD is gaining momentum to further uptrend; in other words Polkadot is bullish in the daily chart. The coin has been soaring higher towards the resistance level of $8.6 ever since it bounced up from the support level of $7.6. It pulled back when it reached the $8.6 level. The buyers intensify their pressure and broke it up, the price increase to test the resistance level of $9.1 where there was a partial breakout before it pulled back to retest the $8.6 level. At the moment, the price is retesting the support level of $8.6.
The fast Moving Average (9 periods EMA) is above the slow Moving Average (21 periods EMA) and the price is trading above the two EMAs as a sign of bullish movement. The price may continue the bullish movement provided the resistance level at $9.1 does not hold and it may increase to $9.6 and $10.3 price level. In case the bears oppose the bulls, the price may decrease to the support level of $8.6, $8.3 and $7.6.
Your capital is at risk
DOTUSD medium-term Trend: Bearish, Tamadoge Obeying Bulls’ Control
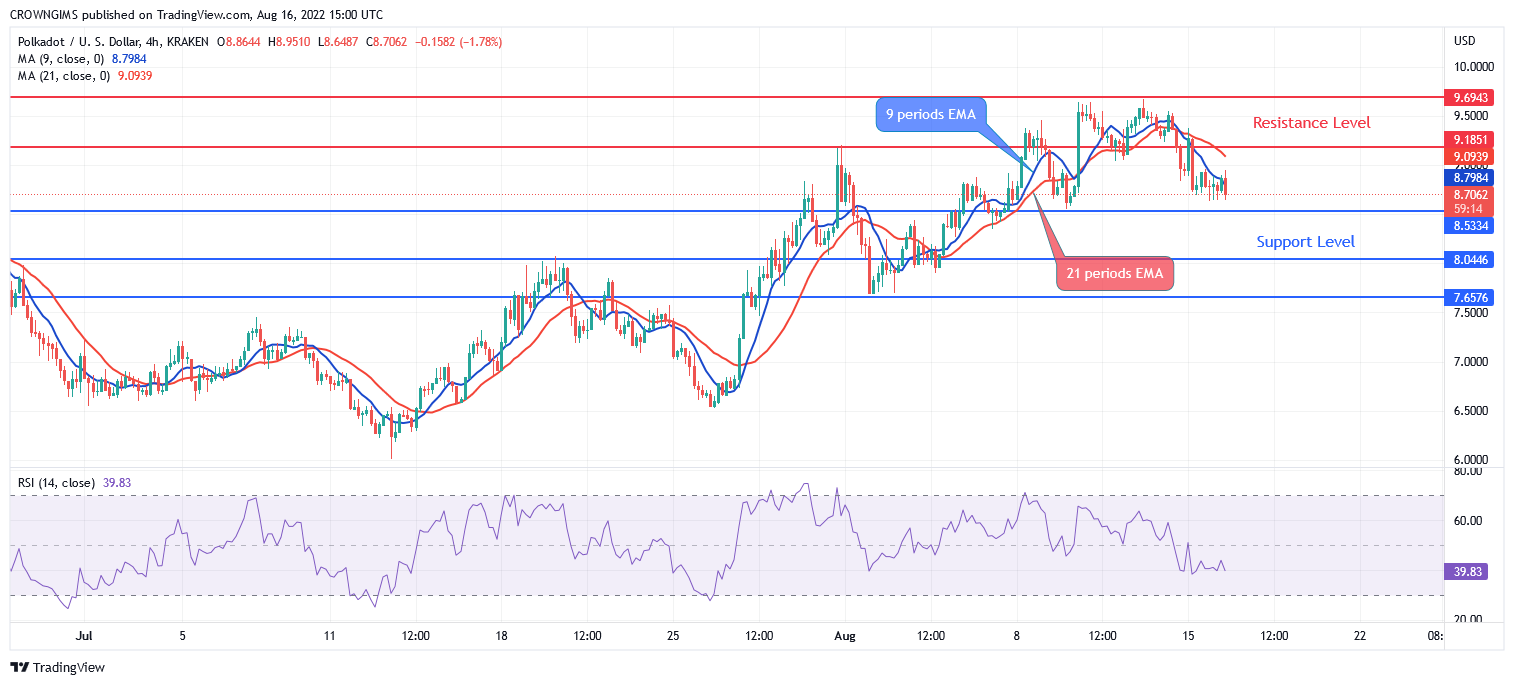
DOTUSD is bearish in the 4-hour chart. The coin was increasing last two weeks. Polkadot reaches the resistance level of $9.6 to form a small double top chart pattern. The pattern formed is a bearish signal to the Polkadot market. The crypto may reach the support level of $8.3 provided the $8.6 level does not hold.
The 9 periods EMA has crossed the 21 periods EMA downside and the coin is trading below the two EMAs which indicates that bears are getting ready to take over the Polkadot market. The relative strength index period 14 is at 40 levels and the signal lines pointing down to indicate sell signal.
Related
Join Our Telegram channel to stay up to date on breaking news coverage


