

Join Our Telegram channel to stay up to date on breaking news coverage
Blockchain instruments do not resemble in any way traditional assets like equities, bonds, real estate, or other cash equivalents. Therefore, comprehending the change in market behavior is a problem that cannot be approached using the same analytical techniques as for traditional assets. We require a new type of study that condenses data from the open blockchain to provide distinct viewpoints, powerful trading tactics and position management.
We can now extract huge data sets from the public ledger of each asset thanks to on-chain analysis. Despite the tiny sample size, we are nevertheless able to record every previous on-chain action. The gathering of blockchain data is essential for analyzing investor and market sentiment. Whether you are a seasoned cryptocurrency trader or not, finding undervalued/overvalued coins requires the use of simplified data.
This post will go through every aspect of on-chain analysis and assist you in getting started with some of the top on-chain resources and analysts available at the moment. Let’s get going.
On-Chain Analysis: What is it?
On-Chain is a singular analysis that establishes a macro view of the cryptocurrency market by taking into account an asset’s ledger and an immutable record of market dynamics. On-chain analysts evaluate supply and demand dynamics, human behavior, buying/selling trends, and miner activity using this radically transparent information.
We may actually develop potential viewpoints to comprehend this open market by having a flawless recollection of every transaction, every trade, and every timestamp. You don’t need to be a data scientist or programmer to undertake on-chain analysis; all you need to know about crypto networks is how they work and how users interact with them.
On-Chain Analysis’s Past
While the majority of the advanced on-chain tools were created over the last three to four years, some of the measures still in use today date back to 2011. We were able to determine when coins were destroyed thanks to the bitcoin valuation metric for indicating the age of bitcoin addresses. The Network Value to Transaction (NVT) ratio, one of the most well-liked measures, was created in 2017 by Chris Burniske and Jack Tatar.
We can precisely calculate a cryptocurrency’s utility value using the NVT ratio, and it also aids in determining the blockchain’s transactional utility.
We frequently compare the NVT ratio to the price-earnings ratio, which is related to equities and may be used in a similar manner to identify companies and coins that increase value. To improve the accuracy of this particular statistic, several iterations were performed. Take the Network Value to Transaction ratio Signal (NVTS), a statistic created by taking the 9-day moving average, as an illustration.
The most recent increase to this statistic was made by Coinmetrics, one of the greatest on-chain tools in the industry, who also employed free float supply to boost the ratio.
There are numerous metrics you can employ to develop various perspectives on the market, and the most of them are based on the idea of UTXOs (Unspent Transaction Outputs). However, because the account models for these networks are difficult to manage, we have trouble creating metrics for Ethereum and ERC-20 tokens.
Though the on-chain community has seen numerous new developments, not much has remained the same. The field of blockchain archaeology is still in its infancy. We have a small number of specialist roles that can generate unique concepts and ideas as well as analyze and translate microdata into macrometrics.
Best on-chain metrics you can use
No on-chain analyst adheres to any guidelines or structures. To forecast market movement, each trader uses a different set of on-chain measures, but practically all cryptocurrency traders rely on a small number of key indications. Here, we’ve included a collection of the most insightful on-chain measures that offer a wider view of the market:
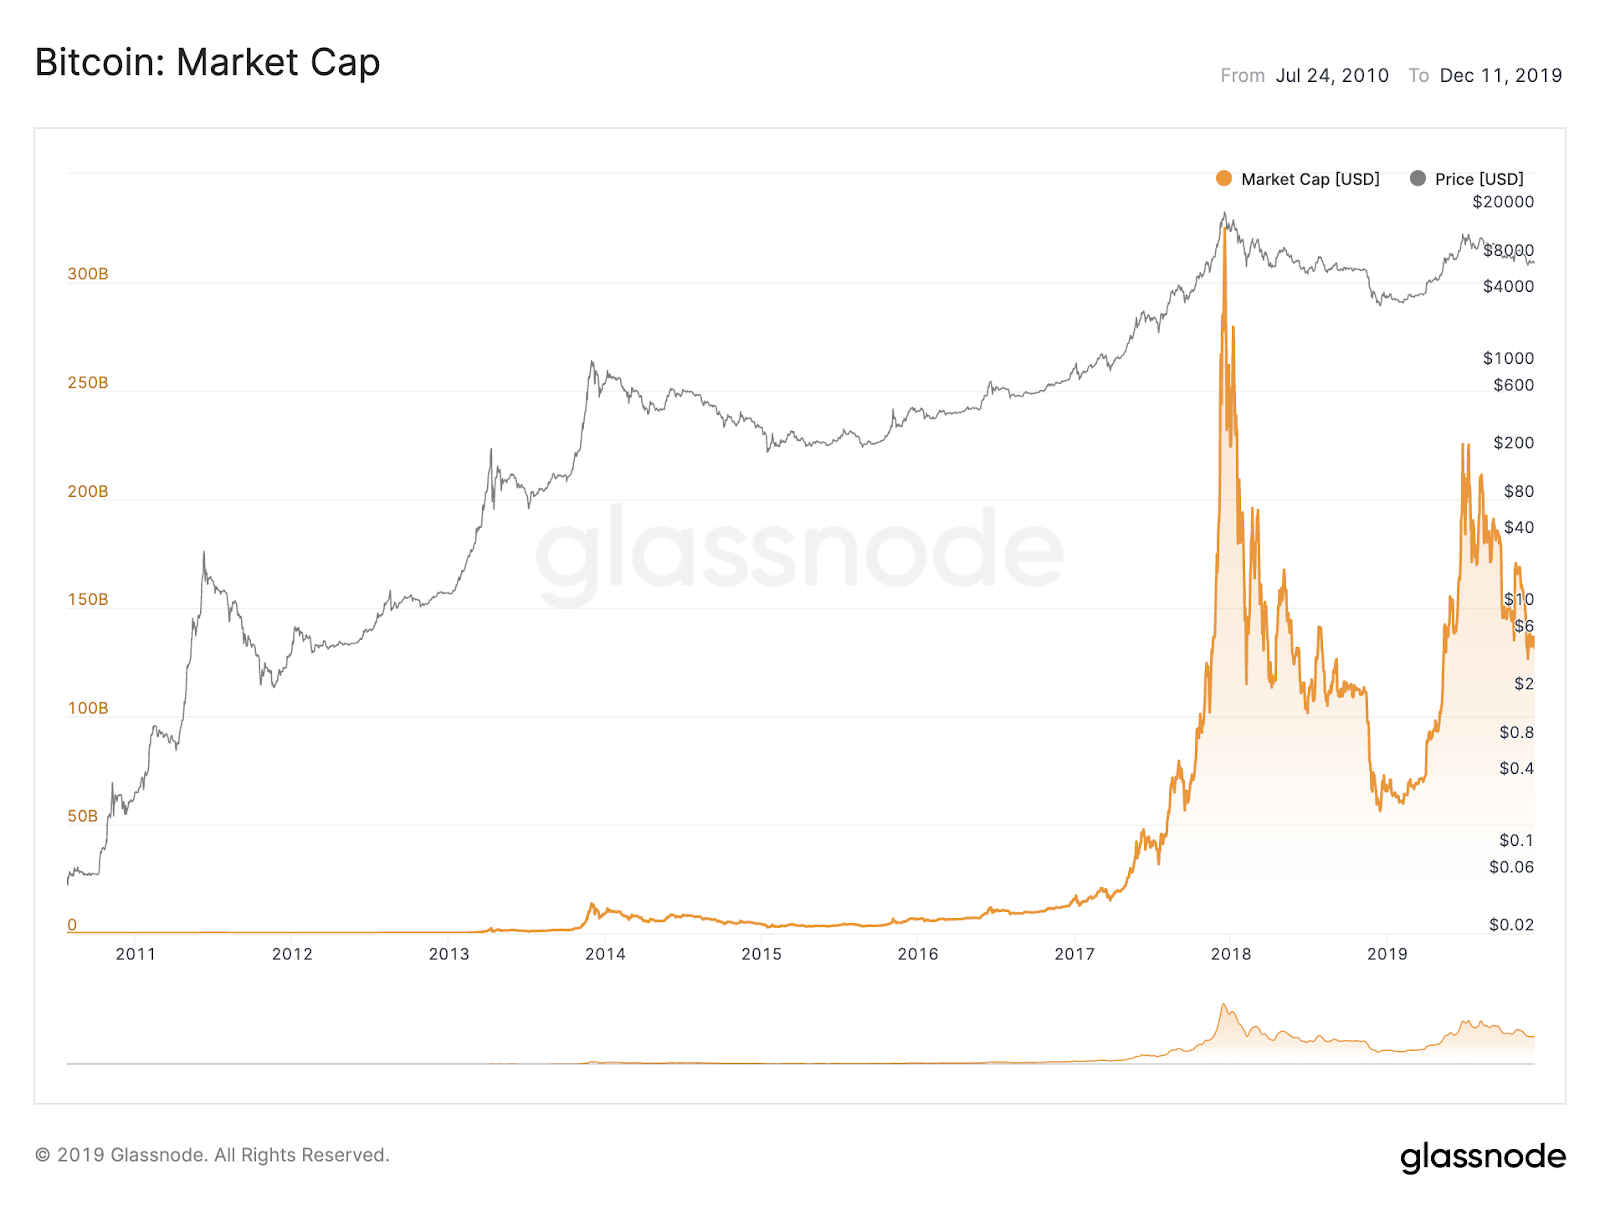
Market cap
An asset’s market capitalization establishes its overall network worth and aids in our understanding of other factors like adoption, market size, and risk. Although there might not be a direct correlation, it is utilized to identify various network properties. The price of an asset and its entire circulating supply are simply multiplied to determine the total network value.
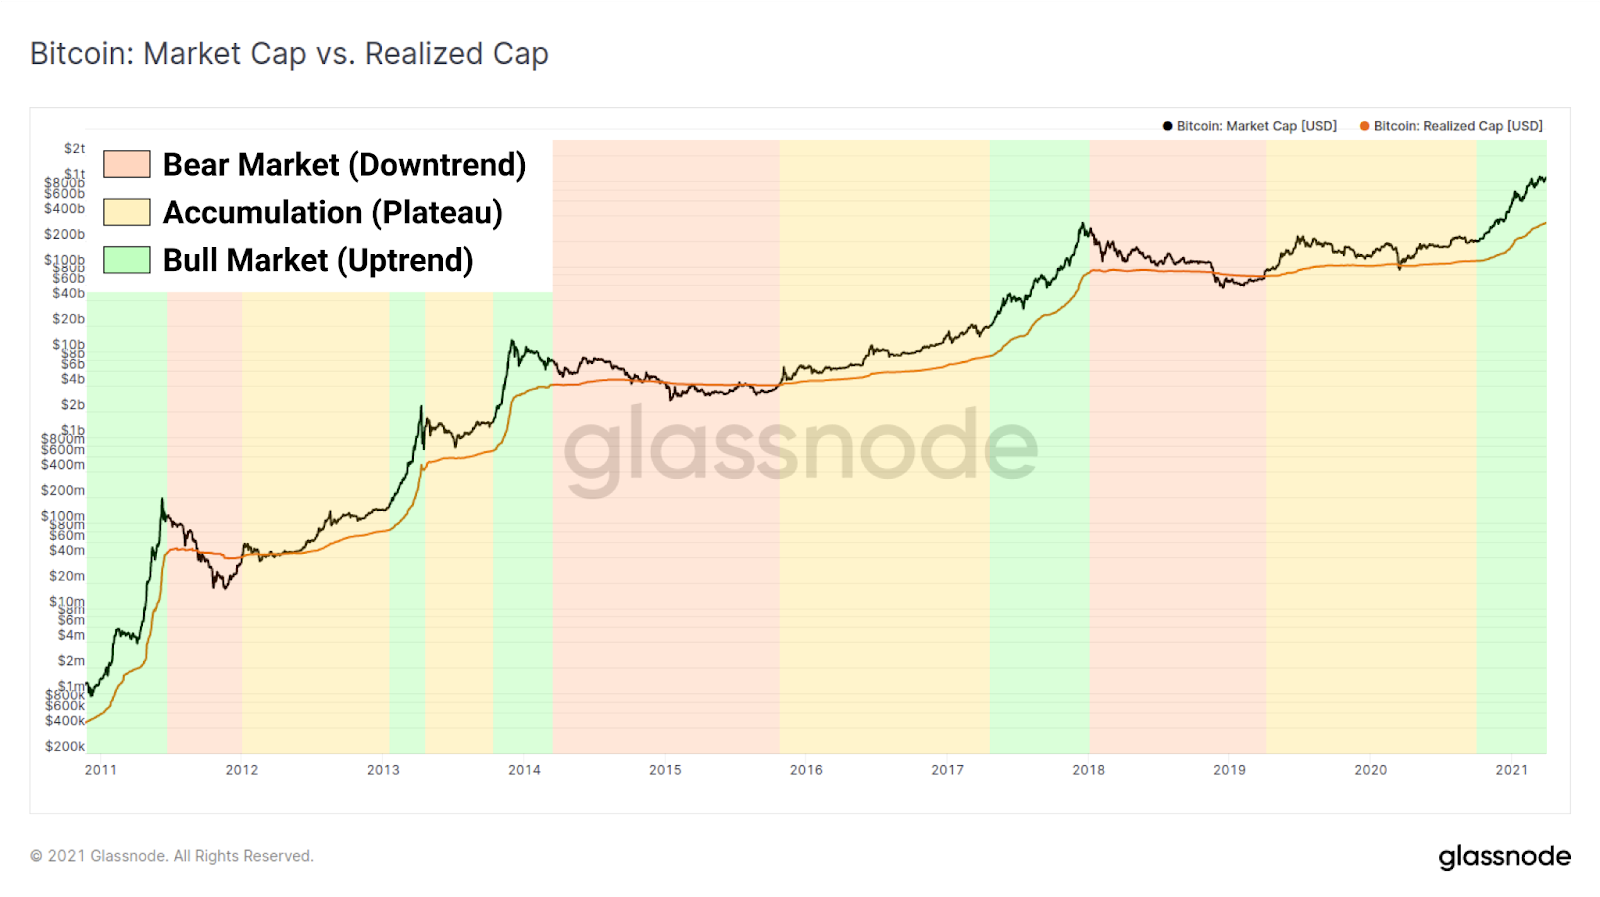
Realized Capitalization
As the transaction outputs are only valued at the price at which they were last changed, this is a variation of the original market cap statistic. The coin’s current worth is not taken into account. All coins that are idle in the network are removed when the market is fully capitalized. Any particular chain’s economics is also impacted by this. If the idle coins were used, their value would be restored to market value, considerably raising the realized ceiling.
Phases of the Market & Cyclical Bottoms
In many situations, the realized cap is used to comprehend market stages and forecast accumulation periods. Based on realized cap data, we have highlighted the following three market periods for you to be aware of:
Bull Market: The definition of a bull market is simple: If the realized cap keeps rising, the market is said to be in a bull phase. Technically speaking, this means coins that were purchased for far less than their current worth are used.
Bear Market: Similar to this, a market is said to be in a bear phase if the realized cap continues to decline. This typically occurs when brand-new players enter the market by purchasing coins through off-chain exchanges.
Accumulation Phases: Long-term holders and wise investors buy as many coins as they can throughout these phases, which ultimately serves as support and illustrates an upward trend in the market cap.
We know a cycle has bottomed out when the market cap is trading below the realized cap. We saw that the realized cap coincided with the bear market floor in 2011 and again in 2013. During the market bottoms and accumulation phases, the realized cap served as both resistance and support in this instance.
Ratio of Market Value to Realized Value
MVRV ratio is a straightforward statistic used to identify market peaks and troughs. We can tell when a price is overvalued or undervalued based on the ratio of market value to realized value.
The MVRV-Z score is used to determine an asset’s valuation, and it is calculated as follows:
MVRV-Z Score = Market Cap – Realized Cap
The LTH-MVRH and STH-MVRV advanced measures were created by utilizing the original MVRV ratio. We may evaluate the actions of long-term investors and short-term investors, respectively, by employing these indicators.
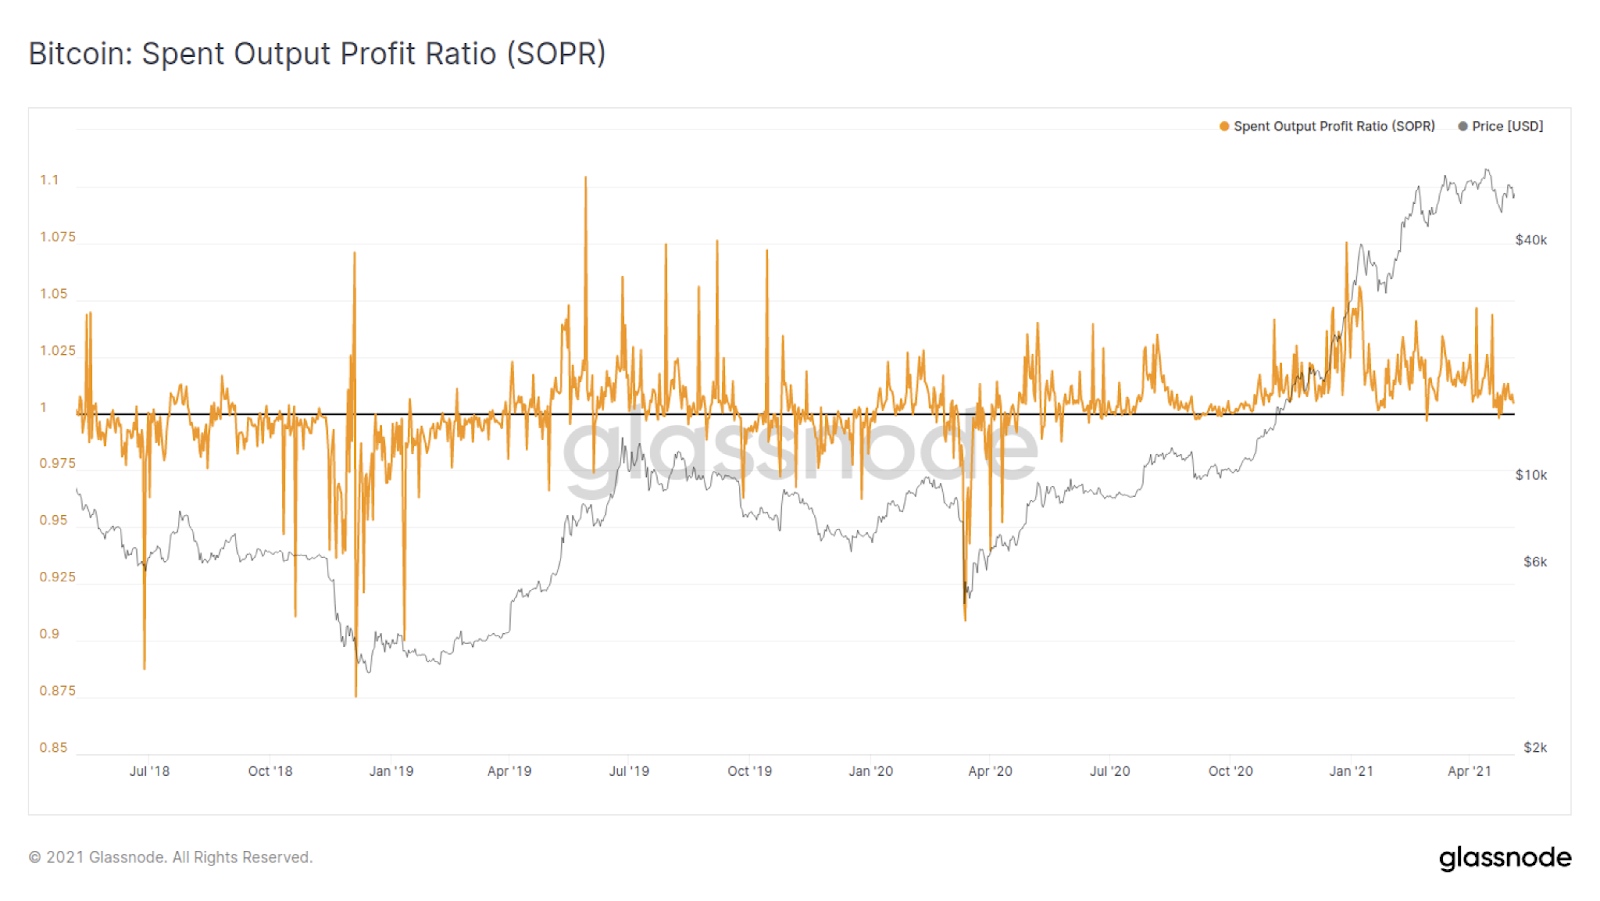
Spent to Output Profit Ratio (SOPR)
SOPR is one of the most popular metrics for determining macro market sentiment and profitability over time. The ratio is created by comparing the coin values realized and at the moment of UTXO generation. For any on-chain investigation, SOPR is crucial since it clarifies daily and hourly market behavior.
You should keep in mind the following patterns and frameworks when using SOPR:
- When SOPR exceeds 1, market participants make money (on average), indicating they are selling their goods for more than they paid for them. Conversely, when SOPR is less than 1, market participants (on average) experience losses, which shows they are selling for less than they paid.
- Selling coins at a break-even price when SOPR reaches exactly 1 (on average).
- Assets that represent an illiquid supply are currently in circulation while the SOPR keeps rising.
- When the SOPR keeps falling, it’s indicating that coins that are profitable are not being traded or that market participants are suffering losses.
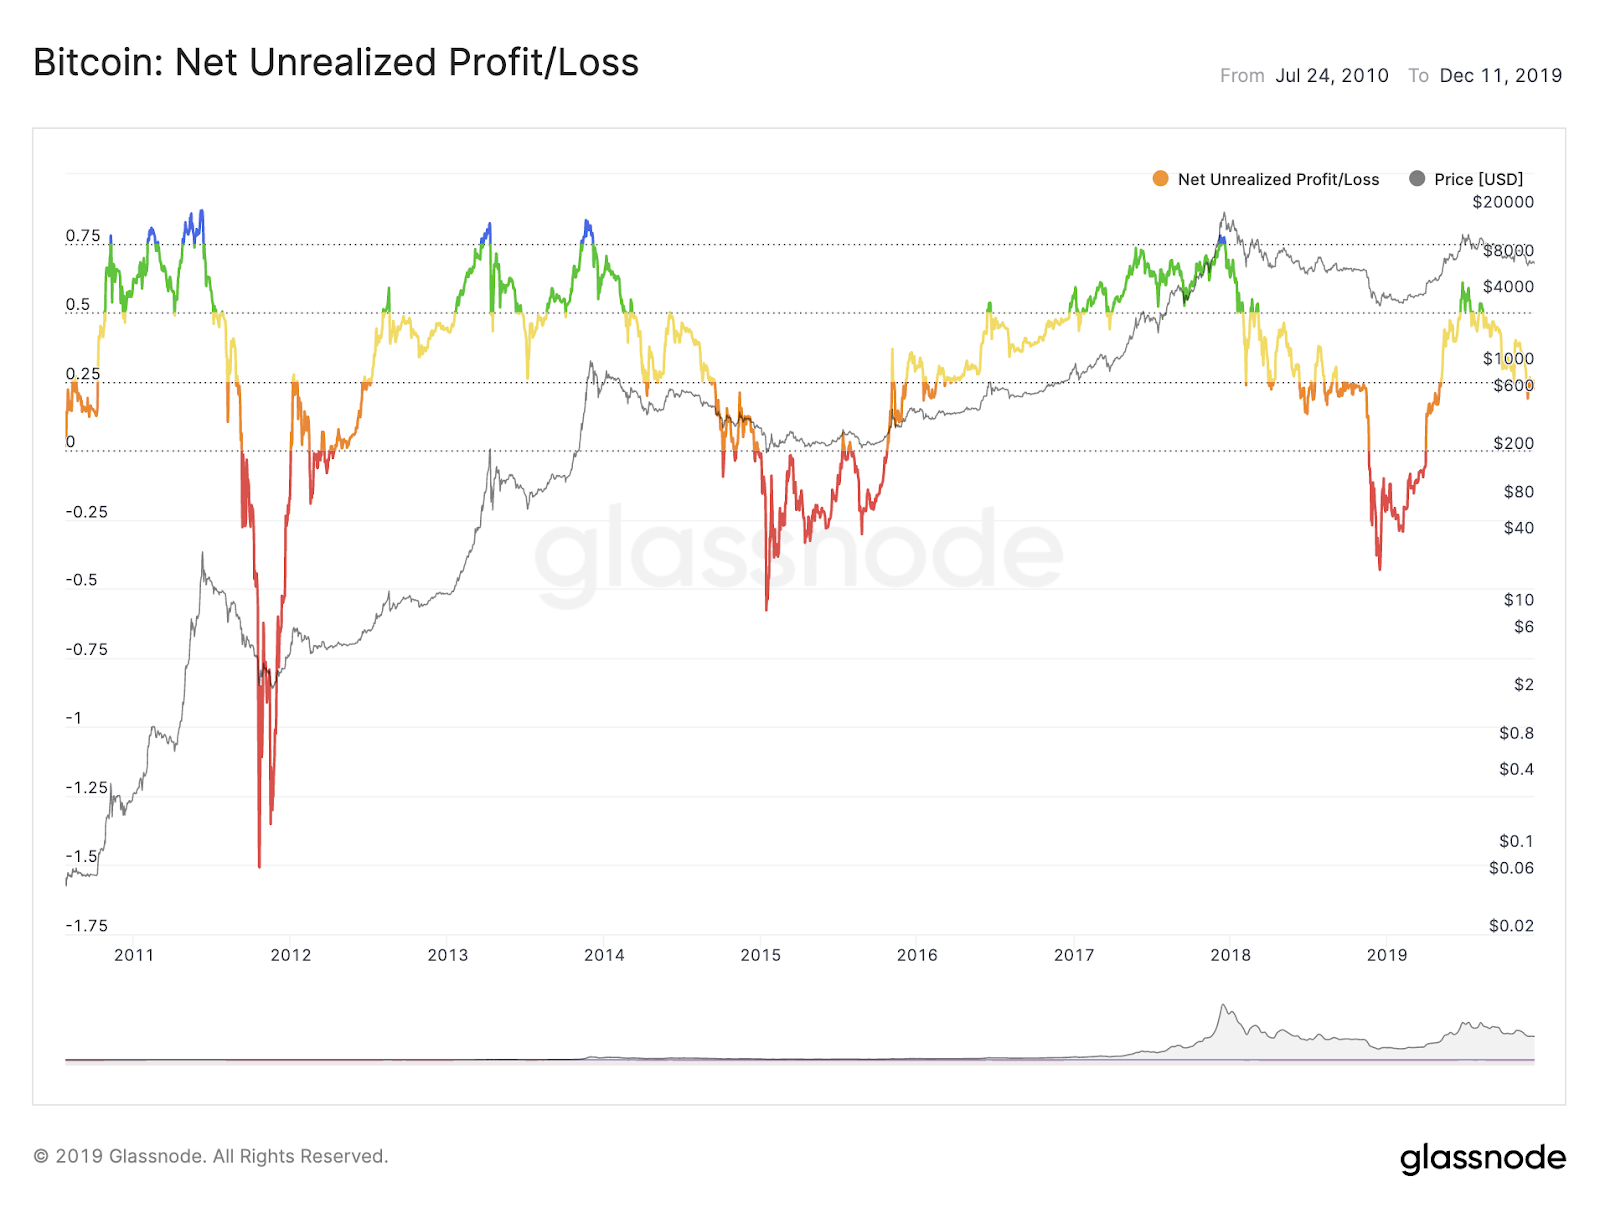
Net unrealized profit or loss (NUPL)
The NUPL is used to assess the network’s condition. We can determine the network’s profitability by computing the difference between realized earnings and losses. The network is in a profit-making state if the NUPL value is greater than zero, and it is in a loss-making condition if the value is lower. When you enter the blue section, you can exit and book earnings. When you enter the red region, you can return.
This statistic also comes in Unrealized loss, LTH-NUPL, and STH-NUPL forms. These can be used to comprehend a certain market niche or to focus on a certain investment demographic.
Puell Mutiple
By contrasting daily coin issuance and the 365-day moving average of daily coin issuance, the Puell Multiple is created. This indicator is valued by many on-chain analysts since it determines miner profitability and income stress.
Profitability of Miners
In order to pay for ongoing operating expenses, new miners must sell their coins. Established mining operations counteract this sell-pressure by keeping extra coins in their treasuries. As a result, we observe that larger capital is absorbing small miners’ sell pressure.
The Puell Multiple will be rising when profits are realized and will quickly surpass the yearly average. We concluded from analyzing historical data that values greater than 4.0 indicate market tops.
Market Bottoms
Puell Multiple is used to assess mining activities and determine market bottoms. It is very difficult for miners to turn a profit and pay for overhead during a protracted bear market. By turning off their hardware, the market conditions drive them off the network. The basic goal of this is to consume less power. They will sell fewer coins and raise their share of the revenue in huge mining communities. Mining profitability has decreased by 50% during the last few cycles, and at that time, the Puell Multiple was less than 0.5. It is now measured to be less than 1.0.
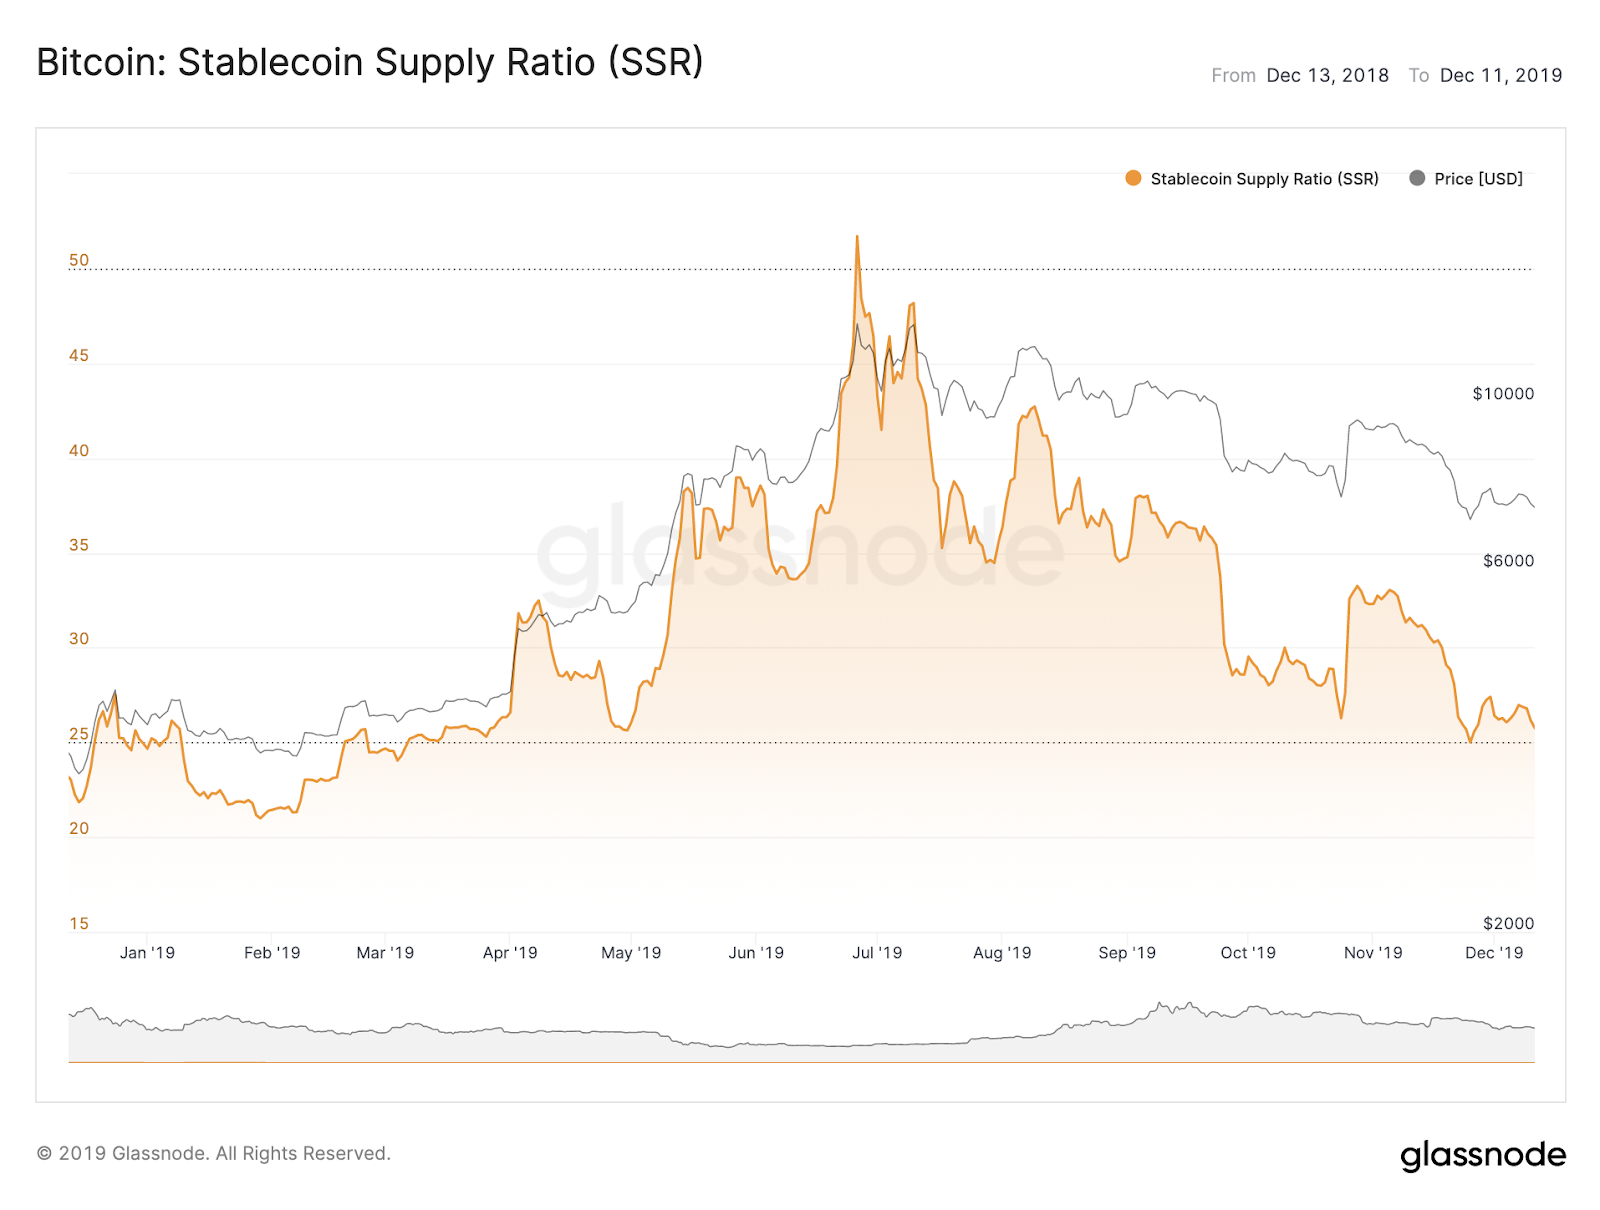
Stablecoin Supply Ratio (SSR)
The stablecoin supply ratio is useful for determining how much BTC is worth. SSR levels below a certain threshold indicate increased buying. Simply said, it serves as a stand-in for the dynamics between BTC and USD.
Network Expansion
Although network expansion is a straightforward statistic to calculate, it provides a more comprehensive view of the market. It is used to spot assets that are gaining or losing traction and represents the adoption of cryptocurrencies over time.
Ethernet network expansion
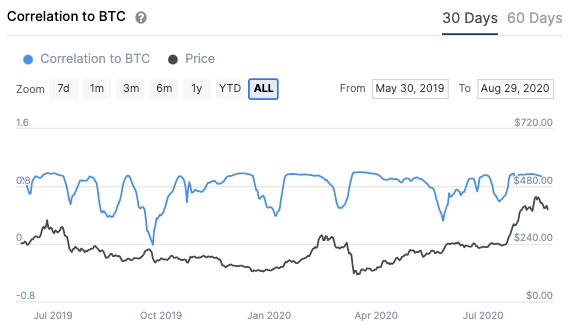
Bitcoin Correlation
This measure is mostly visible on intotheblock. The Correlation to the BTC indicator enables us to evaluate how various assets are impacted by changes in bitcoin’s price. We can see the statistical link between two variables using this metric. It is indirectly proportional to bitcoin if it is smaller than one. We see a positive link if the number is nearer to one. Correlation to BTC aids investors in reducing risk. When the price of BTC plunges sharply, we can take the appropriate actions to limit losses to assets linked to it.
Best 5 On-Chain Tools
You can experiment with the many on-chain tools that are currently accessible now that you have a basic understanding of on-chain analysis and the metrics used to evaluate the market. The top five on-chain tools are given below:
Glassnode
One of the top on-chain data and intelligence solutions, Glassnode offers a live data explorer as well as a variety of analytical metrics for various assets. On glass node insights, they publish a weekly issue that offers both a qualitative and quantitative assessment of the market. Additionally, they provide in-depth articles about well-known blockchains and digital assets, which are useful to study in order to comprehend markets using historical data. Right now, you can open a free account and gain access to a number of indicators. The advanced plan ($39) and the professional plan ($799) are your two investment alternatives.
Santiment
Santiment is an innovative on-chain solution that is accessible to both developers and traders. Developers get access to technical documentation about logic, algorithms, and several other Santiment measures, while traders have access to a different set of use cases and tutorials. Additionally, the site provides a variety of solutions to assist traders with crypto analytics. For spreadsheet plugins and requesting data batches, you can use Sansheets and SanAPI, respectively. Surprisingly, Santiment offered SAN tokens as well to counteract the existing price projections, and they intend to add stalking and burning features.
Coinmetrics
One of the most reliable on-chain systems for data and insights is Coinmetrics. It was started in 2017 as an open-source initiative with the goal of giving public blockchains economic value. They now offer a variety of products and services to support their mission and vision and assist customers in making well-informed crypto investment choices. The four primary services provided by Coinmetrics are risk management, indexes, network data, and market data. In order to make it easier to track data and cryptocurrency values, they also have a smartphone application.
Cryptoquant
Using many measures, including exchange flows, miner flows, bank flows, network data, and market data, Cryptoquant analyzes bitcoin, ethereum, stablecoin, and altcoins as a whole and provides an overview of network state. You can select from their four plans: basic, advanced, professional, and premium. Custom notifications are the key distinction between these programs. Each measure has various alerts that traders may set up to notify them when it rises or falls outside of predetermined boundaries. All metrics are available in the free edition, but there are no personalized notifications or premium features.
Intotheblock
Intotheblock produces accurate reports and offers market insight for the cryptocurrency sector by utilizing data science and AI. It offers consumers directional price forecasts, Defi market statistics, and market sentiment analysis in addition to blockchain analytical tools. Any novice cryptocurrency trader may easily navigate through the various financial and network data thanks to the application’s user-friendly design.
You should follow these three on-chain analysts on Twitter
When it comes to sifting through blockchains to find investment signals, Willy Woo is among the finest in the industry. In 2016, he began working as an on-chain analyst and became fascinated with the technological aspects of the bitcoin network. He currently writes forecasts every two to three weeks for his paying subscribers. Willy Woo has an engineering degree with honors and twenty years of experience as a tech entrepreneur, which make him an authority on on-chain.
Checkmate, one of the most prominent on-chain analysts on Twitter, collaborates with Glass Node to produce newsletters and weekly issues. Everything you need to know about on-chain analysis is covered in his masterclass, and the greatest part is that you’ll join a community of like-minded crypto fans that is constantly expanding.
Will Clemente, a 19-year-old East Carolina University finance major, offers insights into different on-chain analytics. Every week on his YouTube channel, he and Anthony Pompliano, with whom he works, discuss the state of the market. Will is quite active with his subscriber newsletters and writes for over 27,000 investors. He assists new investors in getting a general understanding of what transpired daily and weekly and primarily employs Glassnode for his research.
In conclusion
On-chain technology will be the foundation of finance in the future, thus it is here to stay and provide market data to crypto traders worldwide. On-chain is still in its infancy, but we can expect a ton of advancements in the years to come. More users will start using on-chain metrics as an extra tool for deal confirmations as more historical data is added and stored there. It is still advised to use the tools mentioned above and look at all metrics, even if you are new to crypto and on-chain analysis. Once the basics are understood, you can delve further, correlate various measures, and develop your own viewpoint on the market. You will always be at a competitive advantage over other players in the bitcoin market if you do this.
Related
- EY Launches Blockchain Platform for On-Chain Data Tracking
- Huobi Group to Launch On-Chain Analytics System to Prevent Crime on Blockchain Networks
- Terra Classic Pumps 70% in Seven Days: Here’s Why
Join Our Telegram channel to stay up to date on breaking news coverage