Join Our Telegram channel to stay up to date on breaking news coverage
XMR Price Analysis – July 15
The bears are back in control of the market as traders may consider selling with bearish candle reversal pattern as confirmation.
XMR/USD Market
Key Levels:
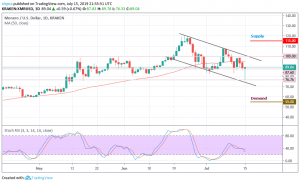
Supply levels: $115, $120, $125
Demand levels: $55 $50, $45

Monero (XMR) price is currently trading at $89.04 with a 24-hour trading volume of $$156,617,966. Meanwhile, the price moves up to gain a 0.4% increase in the last 24 hours. At the opening of today’s market, the price suddenly moved down to test the support level of $76.76. The last time the price reached this support level was on May 17, 2019.
Moreover, after the retesting, the bulls couldn’t cope with the downward trend any longer and begins to push the price from the low of $76.76 to where it’s currently changing hands at $89.04. Similarly, if the movement continues as it is now, the price may likely hit the supply levels at $115, $120 and $125 respectively. In other words, the demand levels to watch out for are $55, $50 and $45 while the stochastic RSI is moving below the 40-level.
XMR/BTC Market
Against Bitcoin, the market price remained and trading within the channel for more than three weeks now, currently trading at the level of 0.0082BTC and expecting a break out below the moving average of 50 days. Looking at the chart, we can see that the bears continue to take control of the market. If the market continues to sell, the next key supports will likely be at 0.006BTC and below.
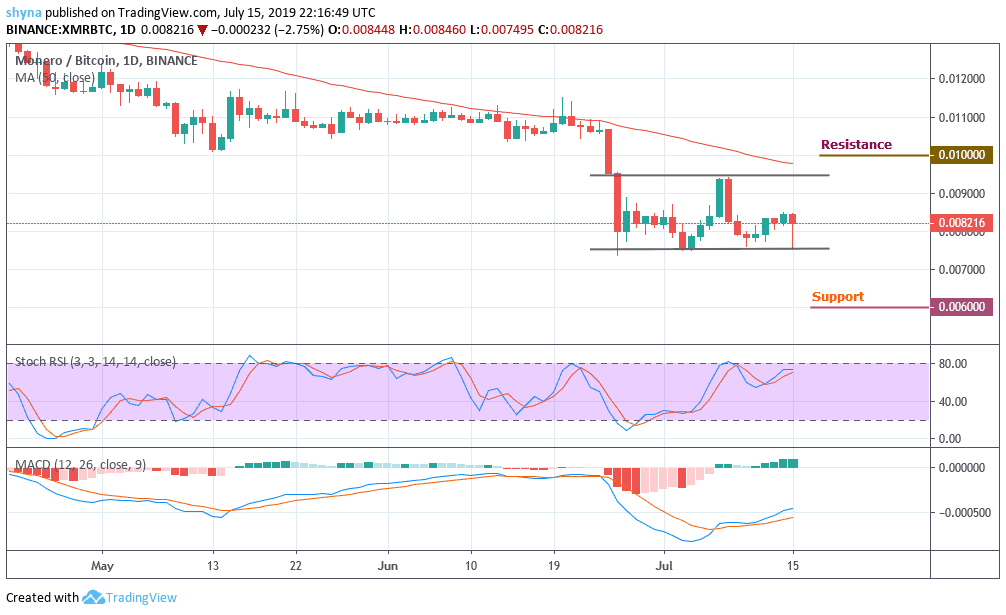
However, on the bullish side, a possible rise could bring the market to resistance levels of 0.010BTC and 0.011BTC. According to the daily stochastic RSI, the market is getting closer to the overbought zone, which could trigger a sell on the market soon, but the MACD continues to give bullish signals.
Please note: insidebitcoins.com is not a financial advisor. Do your own research before investing your funds in any financial asset or presented product or event. We are not responsible for your investing results.
Join Our Telegram channel to stay up to date on breaking news coverage