Join Our Telegram channel to stay up to date on breaking news coverage
Bears dominate MATIC market
Polygon (MATICUSD) Price Analysis – September 26
In case the bears exert more pressure, the support level of $0.74 may be penetrated, then, the support level of $0.64 and $0.47. In case the bull defend the support level of $0.74, MATIC may continue a bullish trend to $0.90, $1.01 and $1.18 levels.
Key Levels:
Resistance levels: $0.90, $1.01, $1.18
Support levels: $0.74, $0.64, $0.47
MATIC/USD Long-term Trend: Bearish
MATIC/USD price is on the bearish trend on the Long-term outlook. The fallen of the Crypto is due to the double top chart pattern formed at the resistance level of $1.01. The bulls were in control of the Polygon market many days before bears took over the market; the bullish trend pushed up the price and found resistance at $1.01. The price decreased to the $0.74 support level on August 26. It pulled back and retested the resistance level of $0.90. At the moment, sellers are exerting more pressure on $0.74 level.
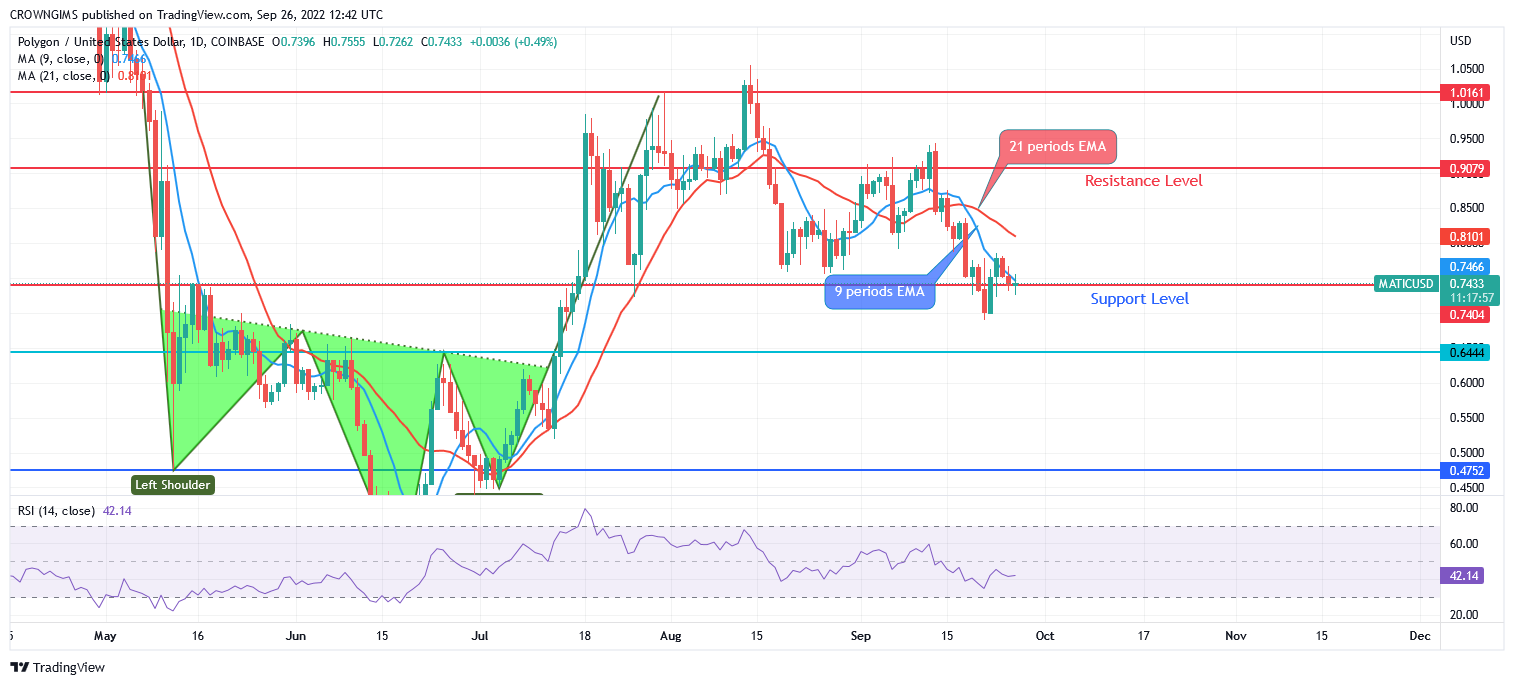
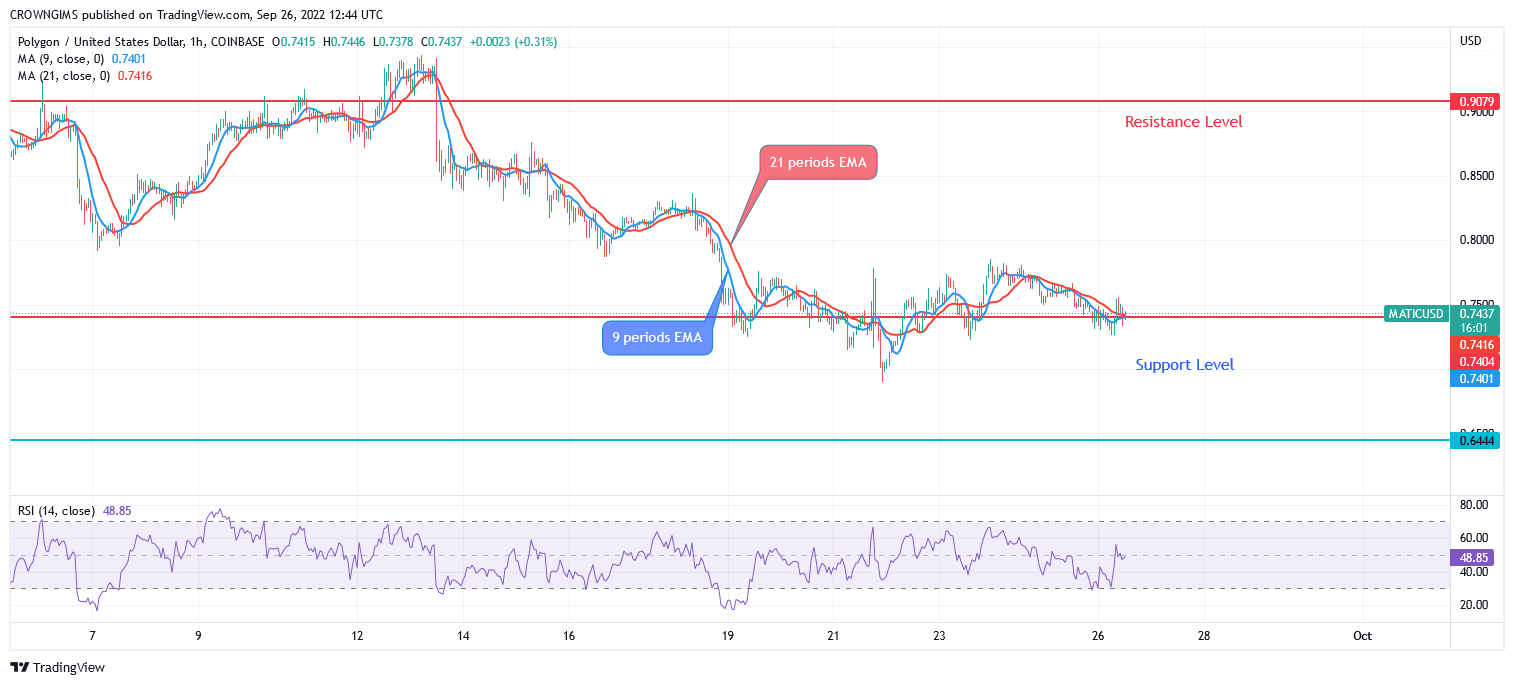
Polygon is trading below the 9 periods EMA and 21 periods EMA. In case the bears exert more pressure, the support level of $0.74 may be penetrated, then, the support level of $0.64 and $0.47. In case the bull defend the support level of $0.74, price may continue a bullish trend to $0.90, $1.01 and $1.18 levels.
Your capital is at risk
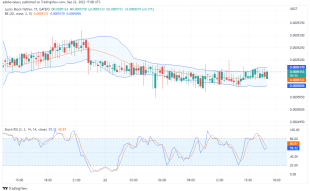
MATIC/USD Short-term Trend: Bearish, Excitement Trails Tamadoge Listing on OKX
Polygon is bearish on the medium-term outlook. Sellers are exerting more pressure on MATIC. After the formation of the short “M” price action on 4 hour chart. The price tested the support level of $0.74. The level holds and the bulls push the price to carry out a retracement to $0.90 level. The price is decreasing trying to break down $0.74 level.
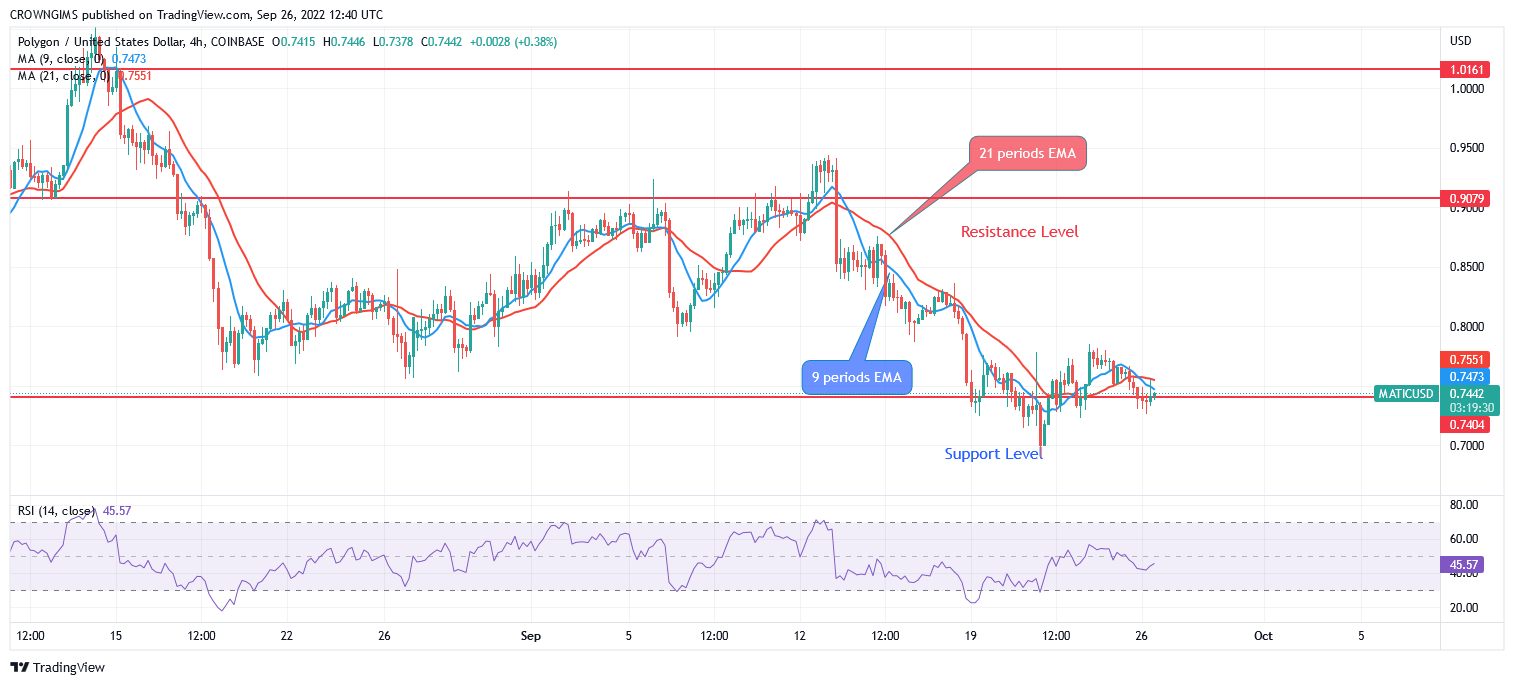
The Polygon price is trading below the two EMAs with close distance between them which indicates a bearish trend. The 9-day EMA is below the 21 periods EMA. However, the relative strength index period 14 is below 43 levels with the signal line pointing down to connote sell signal.
Stay tuned to the crypto news feed here at InsideBitcoins for more updates on Tamadoge’s first exchange listing as the Sept 27th listing date approaches. The OKX website has announced that TAMA withdrawals will be open at 13:00 UTC on the day of the listing
Join Our Telegram channel to stay up to date on breaking news coverage