Join Our Telegram channel to stay up to date on breaking news coverage
Mantra (OM) has seen a significant price surge, climbing to $7.55 after reaching an all-time high of $7.96. Its recent listing on ByBit has further fueled bullish momentum, drawing increased investor interest and strengthening its position in the real-world asset (RWA) tokenization sector. Will this momentum continue to push OM to new heights?
OM Key Statistics
- Current Price: $7.55
- Market Cap: $7.34 billion
- Trading Volume (24h): $982 million
- Circulating Supply: 972 million OM
- Total Supply: 1.81 billion OM
- CoinMarketCap Ranking: #22
Mantra has demonstrated impressive growth, climbing 1.99% from its highest price in the past 30 and 7 days. Even more notably, it has skyrocketed by 131.90% and 39.06% from its lowest recorded prices over the same periods, reflecting strong bullish momentum and increasing confidence from investors.
OM/USD Market
Key Levels
- Resistance: $7.96, $8.50, $9.00
- Support: $$7.17, $5.72, $4.28
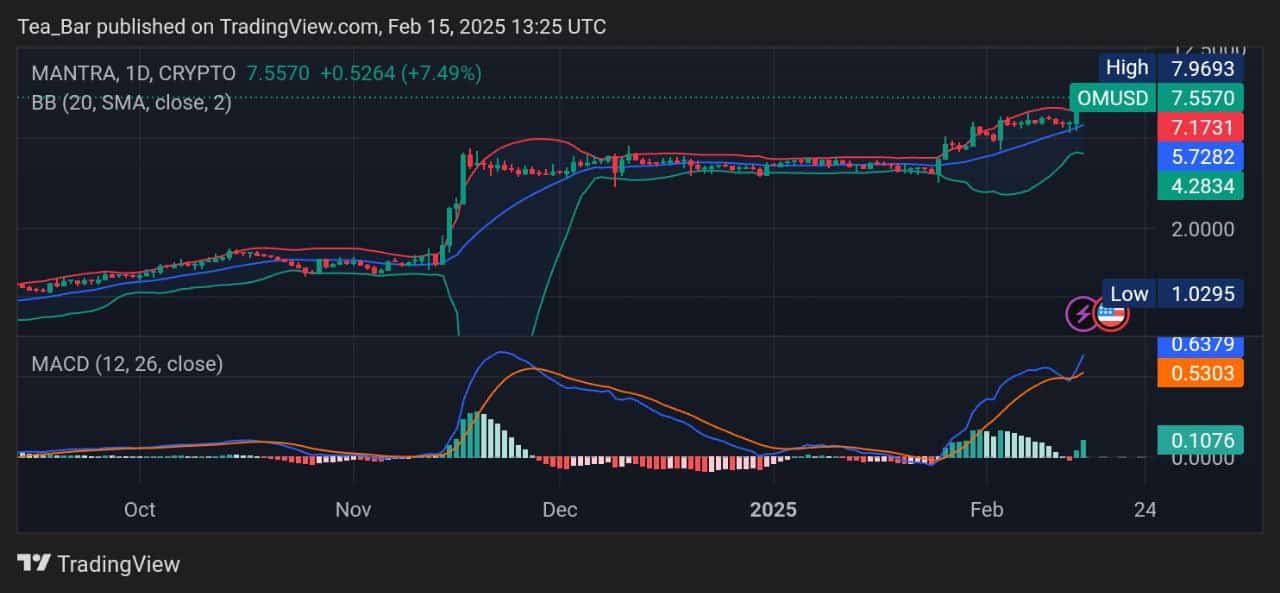
The OMUSD daily chart exhibits a strong uptrend, with price currently trading at $7.55, reflecting a 7.49% gain. Immediate support lies at $7.17, with deeper levels at $5.72 and $4.28. If bullish momentum sustains above $7.17, OMUSD could consolidate before another upward push. However, a break below $5.72 might signal weakening momentum, potentially inviting further declines toward $4.28.
On the resistance side, OMUSD faces its first challenge at $7.96, the recent high. A decisive breakout beyond this could pave the way for a surge towards $8.50, with further bullish expansion possibly testing $9.00. If rejection occurs at resistance, price action may turn volatile, leading to a period of consolidation or retracement. The MACD’s bullish crossover supports upward momentum, but traders should watch for potential divergence signals that might indicate slowing strength. For now, the path of least resistance favors bulls, provided critical supports remain defended amidst this electrifying uptrend.
How High Can Mantra (OM) Go After Reaching Its $7.96 ATH?
Mantra (OM) is currently trading at $7.55, maintaining strong bullish momentum after reaching its all-time high of $7.96 on February 14. With buying pressure still present, OMUSD has the potential to break above this recent peak and target the $8.50 level. The uptrend is supported by increasing investor confidence and sustained market interest. If buyers continue to push prices higher, OM could enter price discovery mode, setting new highs. However, a failure to hold above key support levels may lead to a temporary retracement before another attempt at higher resistance.
How High Can Mantra Go?
Fundamentally, Mantra’s surge is driven by the increasing demand for real-world asset (RWA) tokenization. Major financial institutions like BlackRock, Apollo Global Management, and Franklin Templeton have already entered the space with their tokenized products, signaling strong institutional interest. As tokenization gains momentum, Mantra stands to benefit from this expanding sector, positioning itself as a key player in the DeFi and RWA integration space. If this trend continues, OM could experience sustained growth, reinforcing its bullish trajectory.
OM/BTC Performance Insight
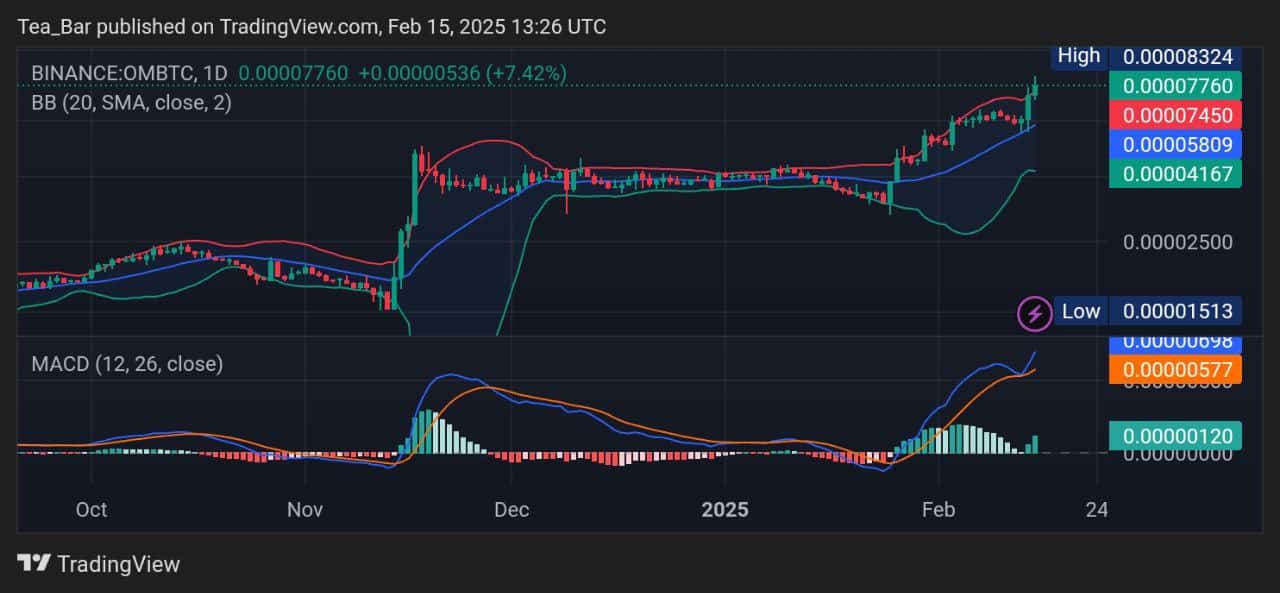
The OMBTC daily chart on Binance shows strong bullish momentum, with the price currently at 0.00007760 BTC, up 7.42% on the day. The Bollinger Bands indicate a breakout, as the price is trading near the upper band, suggesting increased volatility and buying pressure. The MACD is in bullish territory, with the MACD line crossing above the signal line, confirming positive momentum. Resistance is seen at 0.00008324 BTC, while support levels are at 0.00007450 BTC and 0.00005809 BTC. If buying pressure sustains, OMBTC could test higher resistance levels, but traders should watch for potential pullbacks.
Meanwhile, Crypto enthusiast ALLINCRYPTO noted on X that Mantra (OM) experienced a 27% surge following its Bybit spot listing, highlighting the growing interest in the project. Over the past 30 days, the layer-1 network for real-world assets (RWAs) has climbed 83%, showcasing its strong market performance. This impressive rally reflects increasing investor confidence in Mantra’s potential within the expanding RWA sector. As institutional adoption of tokenized assets accelerates, OM’s upward trajectory could continue, positioning it as a key player in the space.
🔥Mantra $OM surges 27% after a Bybit spot listing. Mantra, a layer 1 network for RWAs is up 83% over the past 30 days. pic.twitter.com/xj1LTloPlz
— ALLINCRYPTO (@RealAllinCrypto) February 14, 2025
Alternatives to Mantra
As tokenization continues to gain traction, Mantra is well-positioned to capitalize on this growing sector, establishing itself as a key player in the integration of DeFi and real-world assets (RWA). However, the rise of innovative challengers like Wall Street Pepe ($WEPE) highlights the industry’s rapid evolution, where fresh concepts disrupt traditional norms and unlock new opportunities.
Wall Street Pepe has quickly captured attention, raising over $70 million in its presale—a strong signal of market enthusiasm for its hybrid model. The overwhelming demand led to the presale selling out completely. Token claims will begin at 2 PM UTC on Monday, February 17th.
Will $WEPE Hit $1 on Release?
By blending meme culture with real utility, $WEPE aims to democratize finance through an accessible trading platform enriched with educational resources and community-driven tools. Its tokenomics reinforce sustainability and growth, allocating 20% to the FROG Fund for strategic expansion, 12% for staking rewards, and 38% for marketing to boost global reach. With its innovative approach and strong economic incentives, Wall Street Pepe is poised to reshape decentralized finance, making it more engaging and inclusive.
Related News
- 6 Best Altcoins To Watch Today February 15 – MANTRA, Solana, Ethena, Render
- Wall Street Pepe Presale Ends Early After WEPE Tokens Soak Up More Than $73M – Listing Soon
Newest Meme Coin ICO - Wall Street Pepe
- Audited By Coinsult
- Early Access Presale Round
- Private Trading Alpha For $WEPE Army
- Staking Pool - High Dynamic APY
Join Our Telegram channel to stay up to date on breaking news coverage