Join Our Telegram channel to stay up to date on breaking news coverage
Lucky Block: 3rd of September, 2022
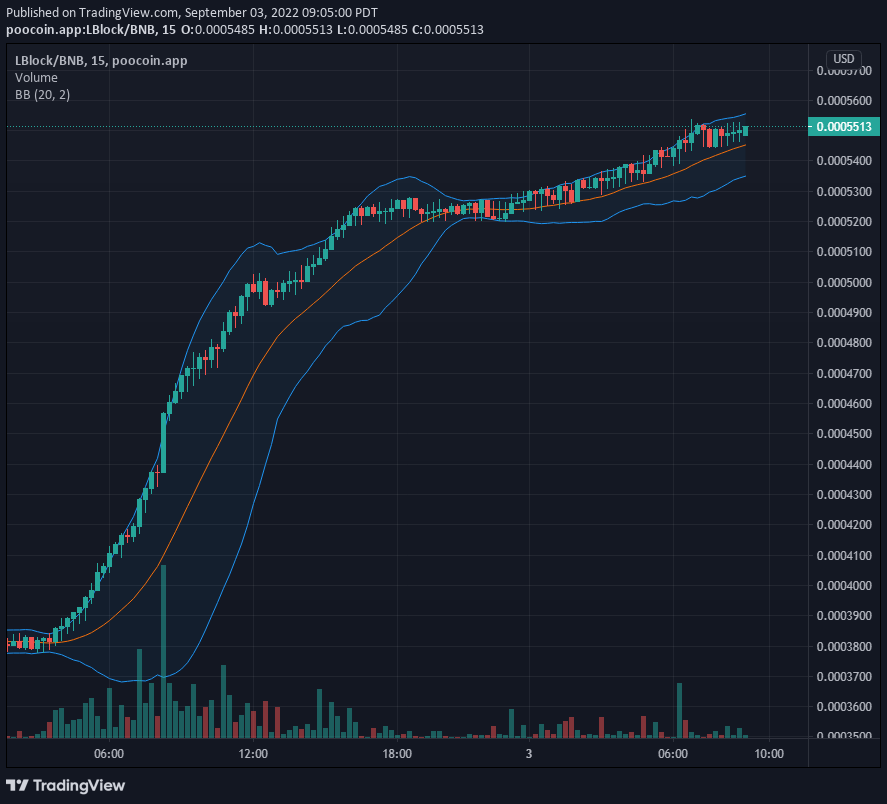
Lucky Block v1 market is showing massive bullishness, as buyers keep pushing prices higher. Also, trading indicators are telling us that we are still in for more upside gains. And, even at this point traders can still hop on the trend and take a lucrative ride upwards and onwards.
LBLOCK v1 Current Value $0.0005518
LBLOCK v1 Market Cap: $22.36 million
LBLOCK v1 Circulating Supply: 40.77 billion
LBLOCK v1 Total Supply: 100 billion
LBLOCK v1 Position on Coinmarketcap: #3296
Major Price Marks:
Resistance Level: $0.0005259, $0.0005518, $0.0006000
Support Level: $0.0005300, $0.000500, $0.0004530
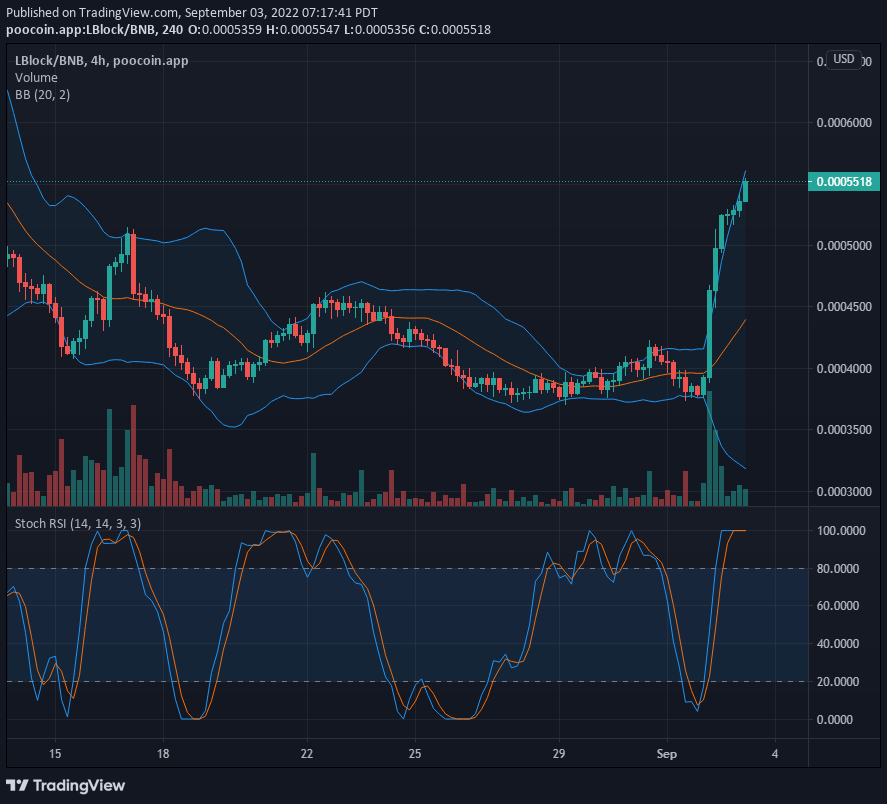
Lucky Block V1 Value Deduction: LBLOCK V1 Keeps Rallying
Lucky Block v1 price action continues to rally towards the upside and trading indicators are still pointing to more upside rallies. Studying the LBLOCK/USD 4 hours trading chart, price action has been able to break the $0.0005500 resistance level. Yet, this crypto looks ready to take on higher resistance. Looking at the Bollinger band we can see that the price candles are relentless in pushing the upper limit of this indicator. Additionally, the Stochastic RSI has arrived at the 100% mark of the RSI, which is the highest point of this indicator. However, going by the strength of buyers in this market, the curve of the RSI may just remain flat out in the overbought area in the meantime as the price continues to rise.
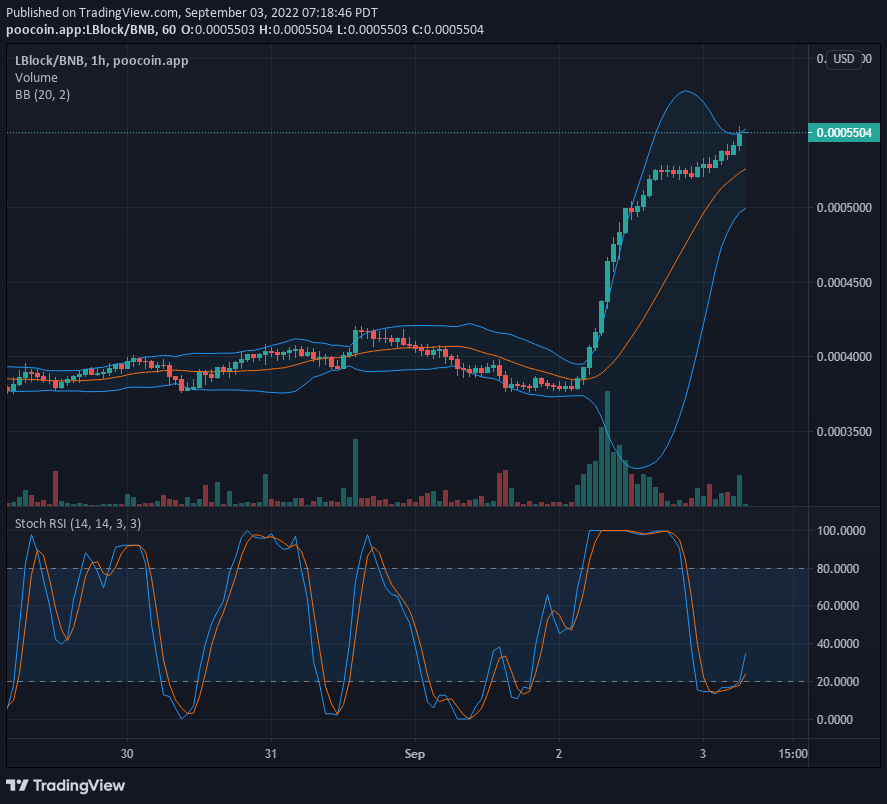
Lucky Block V1 Price Analysis: LBLOCK V1 Hourly Chart Confirms More Upside Gain
The LBOCK v1 hourly chart affirms that its value will continue to see the upside. Here on the LBLOCK/USD hourly chart, we can see that the Bollinger band is pointing upwards to indicate the prevalent trend in this market. We can also see that price stays above the already broken level of $0.0005500. Furthermore, the Stochastic RSI curves as well point sharply upwards. Additionally, there is yet more space for the uptrend to gain momentum before reaching the 100% mark, on the RSI. Summing up the signs in this market we can anticipate that the price of this crypto may reach the $0.0008500 price level soon.
Lucky Block (LBLOCK V2): Gate.io listing has been set to be done on 25th August.
You can purchase Lucky Block here. Buy LBLOCK
Related
Join Our Telegram channel to stay up to date on breaking news coverage