

Join Our Telegram channel to stay up to date on breaking news coverage
Lucky Block Price Prediction – May 18
LBLOCK has rebounded above $0, 001233 price level as it resumes uptrend. Nevertheless, the current bullish momentum is approaching the overbought region of the market. The implication is that the current uptrend will be short-lived.
LBlock price now – $0.001339
LBlock market cap – $47,847,073
LBlock circulating supply – 37.23B LBLOCK
LBlock total supply – $133,891,163
LBlock Coinmarketcap ranking – #3406
Key Levels:
Resistance levels: $0.0016, $0.0018, $0.0020
Support levels: $0.0014, $0.0012, $0.0010

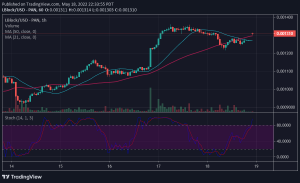
LBLOCK/USD Medium-term Trend: Ranging (1-hour chart)-It Resumes Uptrend
The Lblock price has resumed upward after the recent breakdown to $0.001239 low on May 18. The coin has broken above the moving averages but it is facing rejection at the recent high. Lblock price is consolidating above the moving averages for a possible upward move. The altcoin is rising to retest or break above the resistance at $0.001348. On the upside, if the bulls break the current resistance level, the market will rally to the previous high of $0.001663. Nonetheless, the uptrend is likely to face early resistance as the altcoin reaches the overbought region of the market. The Lblock price is above the 80% range of the daily stochastic. LBlock/USD is trading in the overbought region of the market. The coin will fall as sellers emerge in the overbought region.
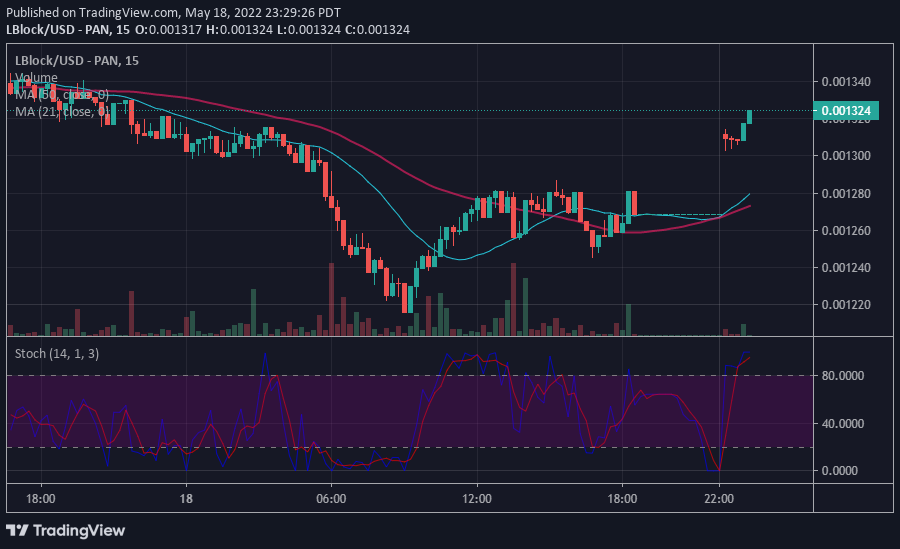
LBLOCK/USD Medium-term Trend: Bearish (15-Minute Chart)
Today, Lblock price has rallied to $0.001324 after the recent price rebound as it resumes uptrend. The altcoin has rallied to an earlier overbought region of the market. There is a possibility of an early price fall. Meanwhile, LBlock/USD is above the 80% range of the daily stochastic. It implies the Lucky block has reached the overbought region of the market. Sellers will emerge to push prices downward.
You can purchase Lucky Block here. Buy LBlock
Join Our Telegram channel to stay up to date on breaking news coverage
