Join Our Telegram channel to stay up to date on breaking news coverage
Litecoin Price Prediction – January 31
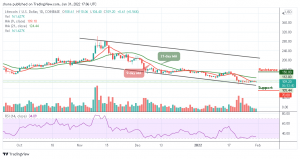
The Litecoin price prediction shows that LTC continues with the sideways movement, while the bulls still defends the support at $100.
LTC/USD Market
Key Levels:
Resistance levels: $150, $160, $170
Support levels: $70, $60, $50

The intraday movement of LTC/USD has not been impressive enough at the time of writing. The Litecoin price is seen hovering around the 9-day and 21-day moving averages with a gain of 0.56%. Should in case the Litecoin (LTC) improves and crosses above the 9-day moving average, the intraday traders may expect a positive close. But presently, most of the top cryptocurrencies are under tremendous selling pressure but traders hope for improvement which may take some time.
Litecoin Price Prediction: Litecoin (LTC) May Spike to the Upside
Looking at the daily chart, the Litecoin price is likely to cross above the9-day moving average if the bullish pressure increases within the channel. Today, the market opened with a little rise after which the bears grabbed the price to touch the daily low of $104.40. However, with this drop, LTC/USD might not be able to maintain its effectiveness before showing some signs of downward trends.
However, the intraday movement of the coin is quite unstable, but a rebound may likely occur and if the bulls can put more effort to push the Litecoin price to cross above the moving averages. Any further bullish movement could locate the potential resistance levels at $150, $160, and $170 while crossing below the lower boundary of the channel could hit the supports at $70, $60, and $50 as the technical indicator Relative Strength Index (14) moves on the same direction below 40-level, suggesting sideways movement for the market.
Comparing with Bitcoin, the Litecoin price has been following a bearish scenario as the coin remains below the 9-day and 21-day moving averages. However, if the coin slide towards the lower boundary of the channel, it may likely cause another sharp drop at 2500 SAT. Breaking this level could further drag the market to the critical support level at 2400 SAT and below.
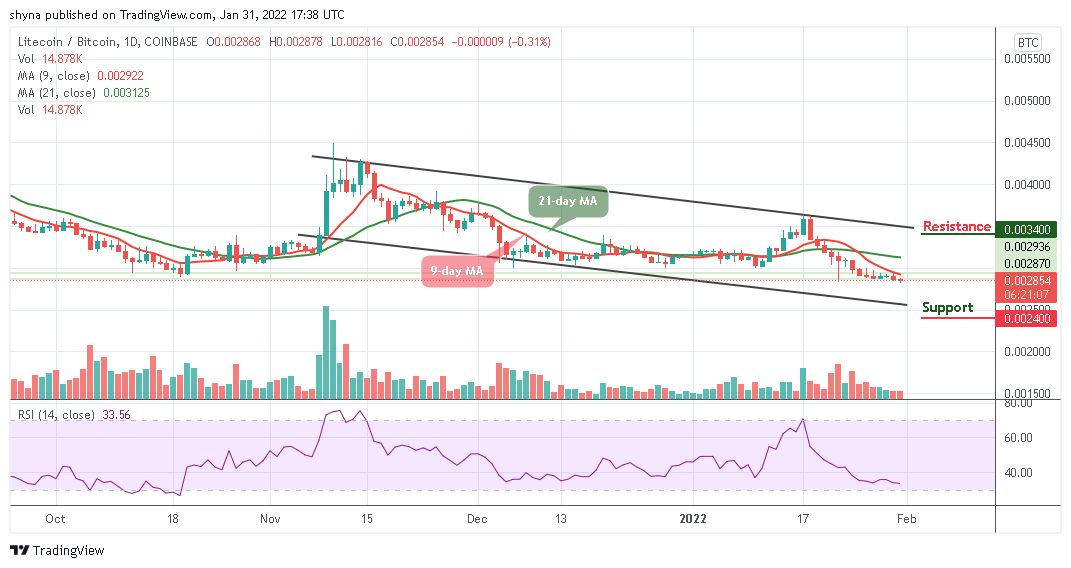
However, LTC/BTC is currently changing hands at 2854 SAT but if the bulls can hold the price and push it above the 9-day and 21-day moving averages, the next key target price may be at 3000 SAT. Reaching this level might move it to the potential resistance at 3400 SAT and above. Meanwhile, the technical indicator Relative Strength Index (14) is dropping towards the oversold region; possible selling pressure is likely if it continues like this.
Looking to buy or trade Litecoin (LTC) now? Invest at eToro!
68% of retail investor accounts lose money when trading CFDs with this provider
Join Our Telegram channel to stay up to date on breaking news coverage