Join Our Telegram channel to stay up to date on breaking news coverage
Litecoin Price Prediction – January 13
The Litecoin price prediction drops below the 21-day moving average as the coin aims to touch the low of $135 support.
LTC/USD Market
Key Levels:
Resistance levels: $160, $170, $180
Support levels: $100, $90, $80
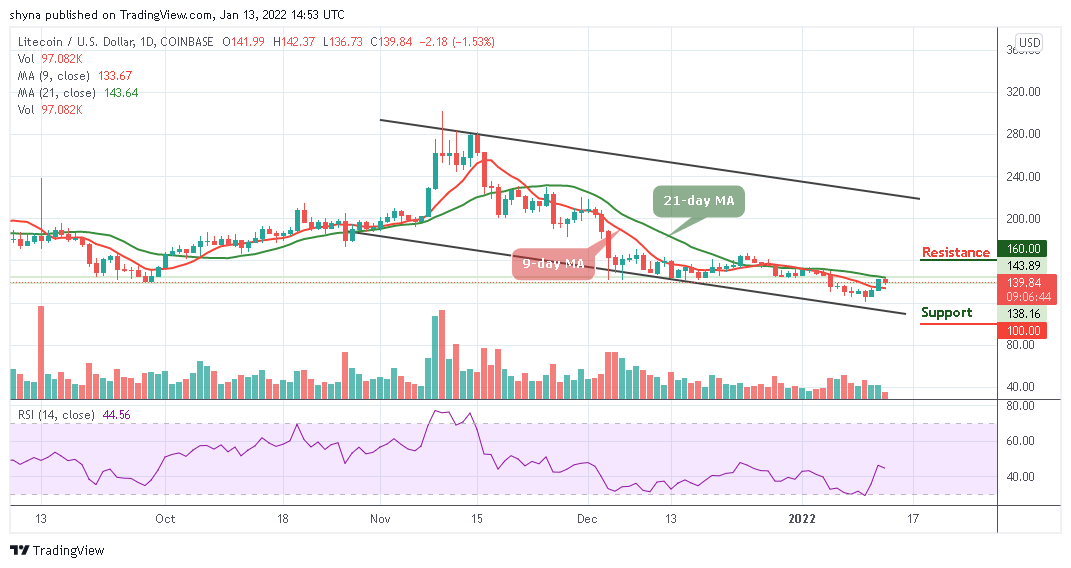
LTC/USD is changing hands at $139.84, down from the recent high of $142.37. The coin is moving synchronously within the 9-day and 21-day moving averages on the market. However, the Litecoin price is mainly influenced by speculative sentiment and technical factors, while fundamental developments remain in the shadows.
Litecoin Price Prediction: Litecoin (LTC) May Move Sideways
The Litecoin price remains within the 9-day and 21-day moving averages as bulls are yet to hold the ground. Therefore, further bearish movement within the market may push the coin below the 9-day moving average with the next local support at $120. This level is likely to limit the correction and serve as a jumping-off ground for another bullish wave.
However, the sell-off is likely to gain traction with the next focus on $100, $90, and $80 support levels. Meanwhile, on the upside, the initial resistance could be created above the 21-day moving average at $140. Traders may need to see a sustainable move above this level to test the resistance level of $150. The further bullish movement could touch the $160, $170, and $180 resistance levels even though the daily Relative Strength Index (14) nosedives toward 40-level, suggesting bearish signals.
Against Bitcoin, the Litecoin price continue to range-bound, as the coin nosedives toward below the 9-day and 21-day moving averages. The bulls couldn’t keep the market above the moving averages as the technical indicator Relative Strength Index (14) moves below 50-level. However, further bearish movement could locate the support level at 2800 SAT and below.
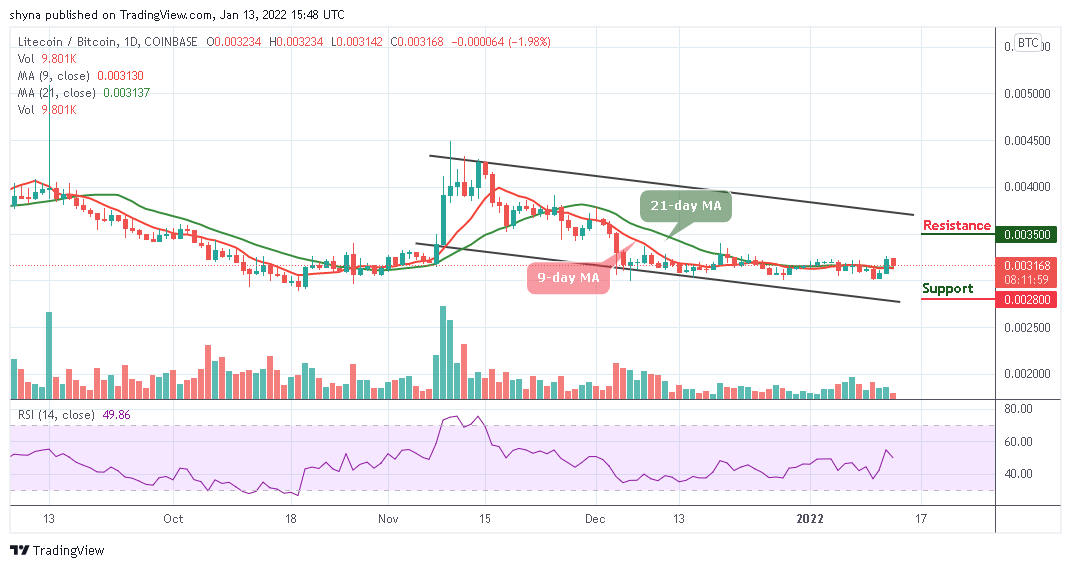
Moreover, if bulls strengthen and power the market, it may likely breakout towards the upper boundary of the channel which could find the potential resistance level at 3500 SAT and above. Meanwhile, at the time of writing, the Litecoin price is currently changing hands to 3168 SAT and a spike in volatility may occur.
Looking to buy or trade Litecoin (LTC) now? Invest at eToro!
68% of retail investor accounts lose money when trading CFDs with this provider
Join Our Telegram channel to stay up to date on breaking news coverage