Join Our Telegram channel to stay up to date on breaking news coverage
Litecoin (LTC) Price Analysis – June 23
The growth of Litecoin (LTC) has attracted investors, currency exchanges and merchants. LTC could reach a new record before the end of 2019.
LTC/USD Market
Key Levels:
Supply levels: $160, $165, $170
Demand levels: $110, $105, $100

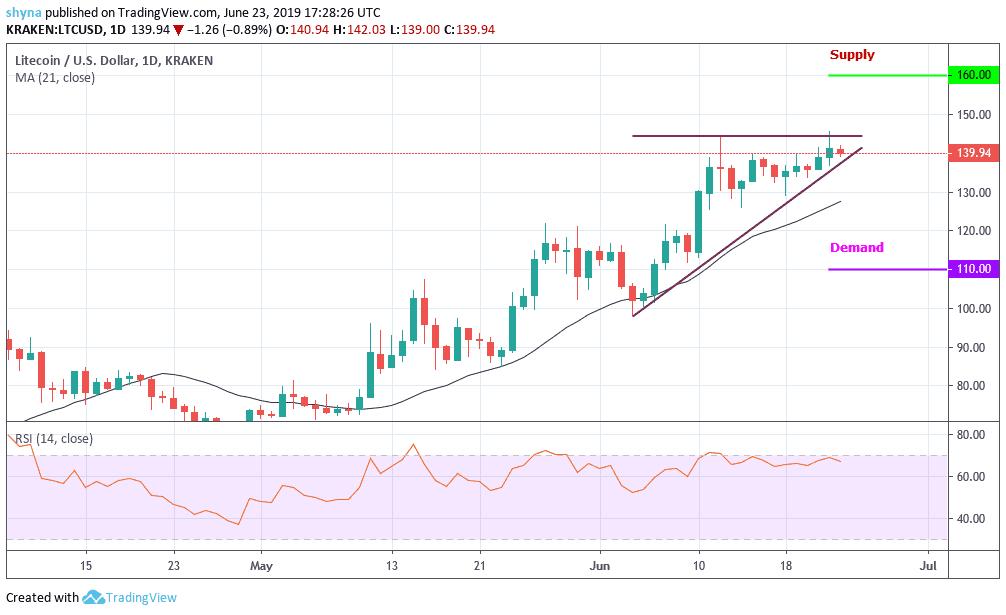
In the last month, LTC increased from $100.71 to its current value of $139.94 on June 23, 2019 (as shown in the daily chart), showing an upward trend of more than 39%. During the month, the currency grew exponentially to $145.62. The momentum was taken just after June 10 and since then there has not been a dull moment in the LTC growth.
In addition, the LTC moves in the symmetrical triangle and trade well above the 21-day MA. The coin has maintained a constant growth trajectory for a few days. Soon it could break the $150 mark and approach the supply levels of $160, $165 and $170. The demand levels to see are $110, $105 and $100 because the RSI 14 is still very close to the overbought territory.
LTC/BTC Market
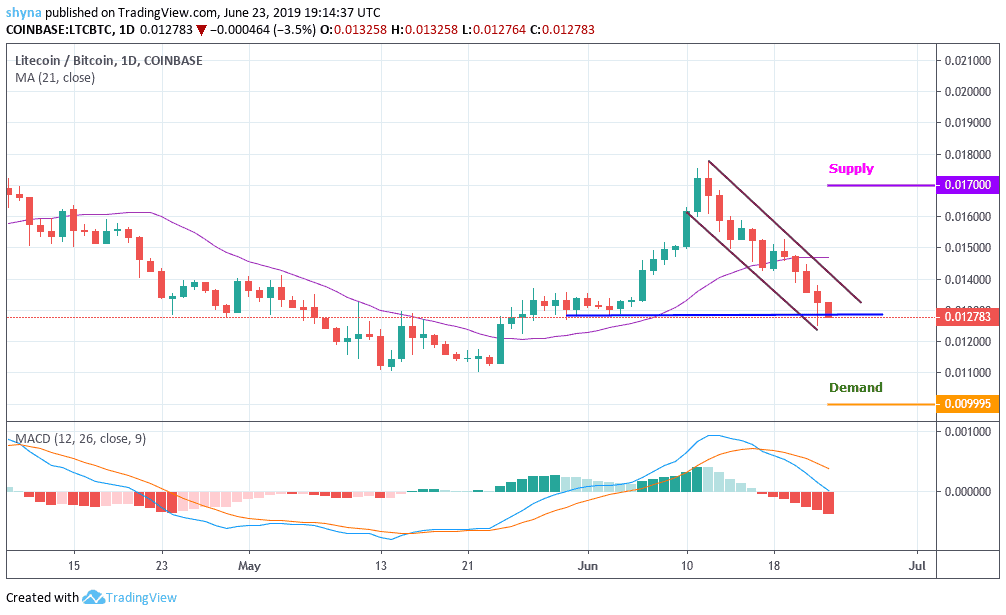
When looking at LTC against the BTC market, we can see that the price has fallen significantly for more than a week as the market approaches the May increase level at the request of 0.0129BTC. The daily MACD had a great impact on the sale since it is now bearish and the price is moving below 21-day MA.

When the Litecoin falls below the demand level of 0.0129BTC, it could significantly lower the price to 0.0099BTC and below. In case of a rebound, we can test the 0.0170BTC and the 0.0180BTC before resuming the rally. If the bulls manage to stay well above the 21-day moving average, we could see a bull-run. But with the current trend, bears are very dominant because the new low may be created.
Please note: insidebitcoins.com is not a financial advisor. Do your own research before investing your funds in any financial asset or presented product or event. We are not responsible for your investing results.
Join Our Telegram channel to stay up to date on breaking news coverage


