Join Our Telegram channel to stay up to date on breaking news coverage
The Kyber Network price prediction shows that KNC could break and stay above the upper boundary of the channel.
Kyber Network Prediction Statistics Data:
- Kyber Network price now – $0.78
- Kyber Network market cap – $136.8 million
- Kyber Network circulating supply – 170.5 million
- Kyber Network total supply – 228.7 Million
- Kyber Network Coinmarketcap ranking – #180
KNC/USD Market
Key Levels:
Resistance levels: $0.90, $0.95, $0.100
Support levels: $0.65, $0.60, $0.55

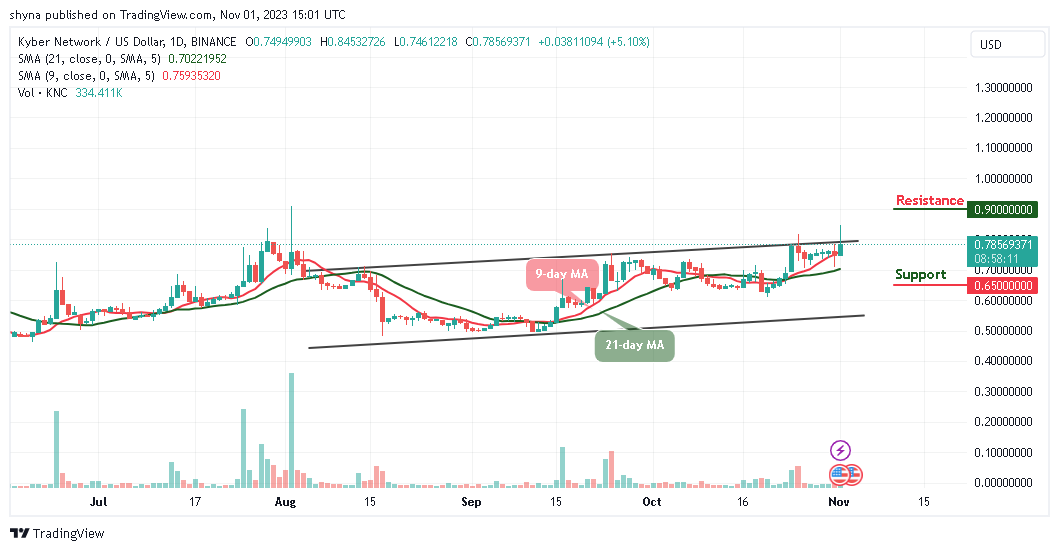
KNC/USD is likely to cross above the upper boundary of the channel to reach the resistance level of $0.85. The coin is currently hovering at $0.78 with a bullish crossover and trend intraday. However, the bulls are dominating the market as all technical indicators confirm the upward movement, but higher support could be found at the $0.85 level.
Kyber Network Price Prediction: KNC Gets Ready to Explode
The Kyber Network price may spike above the channel in the positive move as the 9-day moving average remains above the 21-day moving average, the coin may continue to experience some bullish signals which can encourage more buyers to enter the market.
Meanwhile, if the 9-day MA crosses above the 21-day MA, the coin may hit the nearest resistance at $0.85, before locating the potential resistance levels at $0.90, $0.95, and $0.100 respectively. Moreover, if the technical indicator decides to make a quick turn and face the downside, there may be a quick bearish drop, which may likely hit the support levels of $0.65, $0.60, and $0.55.
KNC/BTC Moves Bullishly
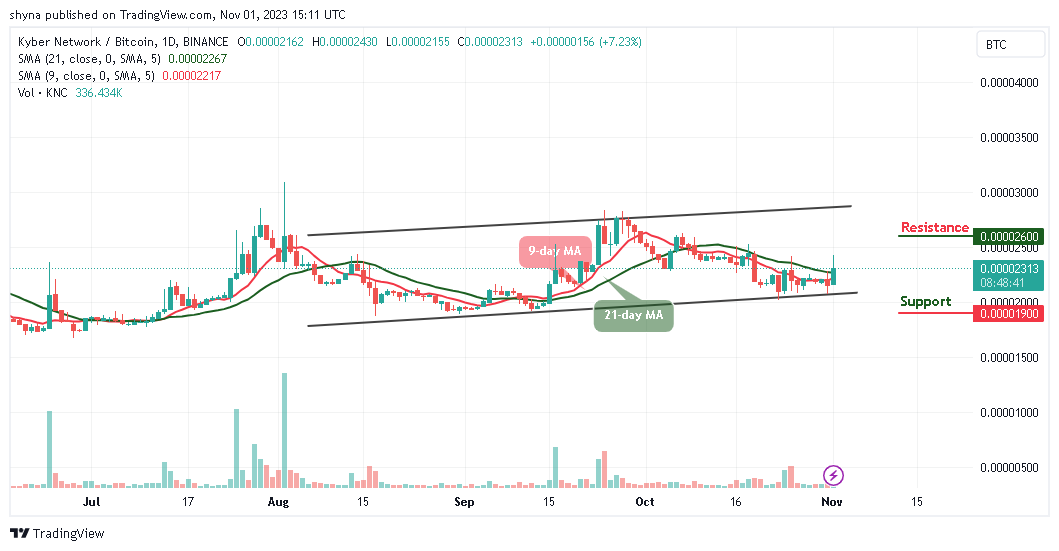
Against Bitcoin, the Kyber Network price is hovering above the 9-day and 21-day moving averages as the price touches the resistance level of 2313 SAT. However, the fact that the market keeps ranging seems to retreat before gaining more uptrends.

Therefore, if the buyers push the market price near the resistance level of 2500 SAT, KNC/BTC may touch the resistance level of 2600 SAT and above. Meanwhile, if the sellers step back into the market, higher selling pressure may cancel the bullish pattern, and this could attract new sellers coming into the market with the next support level at 1900 SAT and below.
Kyber Network Alternatives
Looking at the daily chart, the next step for the Kyber Network price is to cross and stay above the upper boundary of the channel. Once this is done, bulls could push the coin to hit the resistance level of $0.85. Meanwhile, the more the bulls pressurized the bears, the higher the coin would reach.
However, the Bitcoin Minetrix project continues to turn heads as it is launching a decentralized cloud mining platform that allows investors to earn passive BTC mining rewards by staking the $BTCMTX token. Meanwhile, the token continues to see impressive demand in its presale, having raised over $3 million so far.
Join Our Telegram channel to stay up to date on breaking news coverage


