Join Our Telegram channel to stay up to date on breaking news coverage
GBPJPY Price Analysis – July 02
Strong pressure from the Bears may break down the demand level of $135 and the price will be exposed to the $130 level. In case the Bulls continue to defend the $135 level consolidation may continue.
GBP/JPY Market
Key levels:
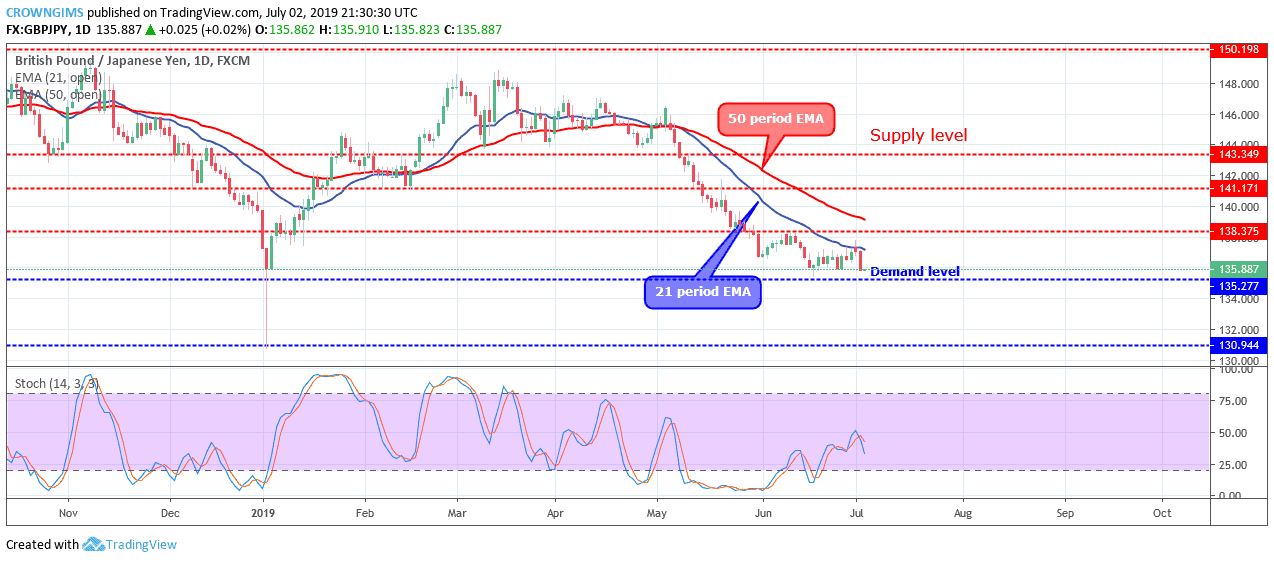
Supply levels: $138, $141, $143
Demand levels: $135, $130, $127
GBPJPY Long-term trend: Ranging
On the long-term outlook, GBPJPY is on the sideways movement. The Bears were unable to break down the demand level of $135 neither the bulls were able to push the currency pair up to reach the supply level of $138. The momentum of both the Bulls and the Bears were at equilibrium. Throughout last week, the pair was range – bound within the $138 and $135 price levels. Today, the Bears dominated the market with the formation of the strong bearish candle.
GBPJPY retain its trading below 21 periods EMA and 50 periods EMA at a close range as the momentum of the Bulls and the Bears are weak. The Stochastic Oscillator period 14 is below 50 levels and the signal lines pointing down to indicate a sell signal. Strong pressure from the Bears may break down the demand level of $135 and the price will be exposed to the $130 level. In case the Bulls continue to defend the $135 level consolidation may continue.
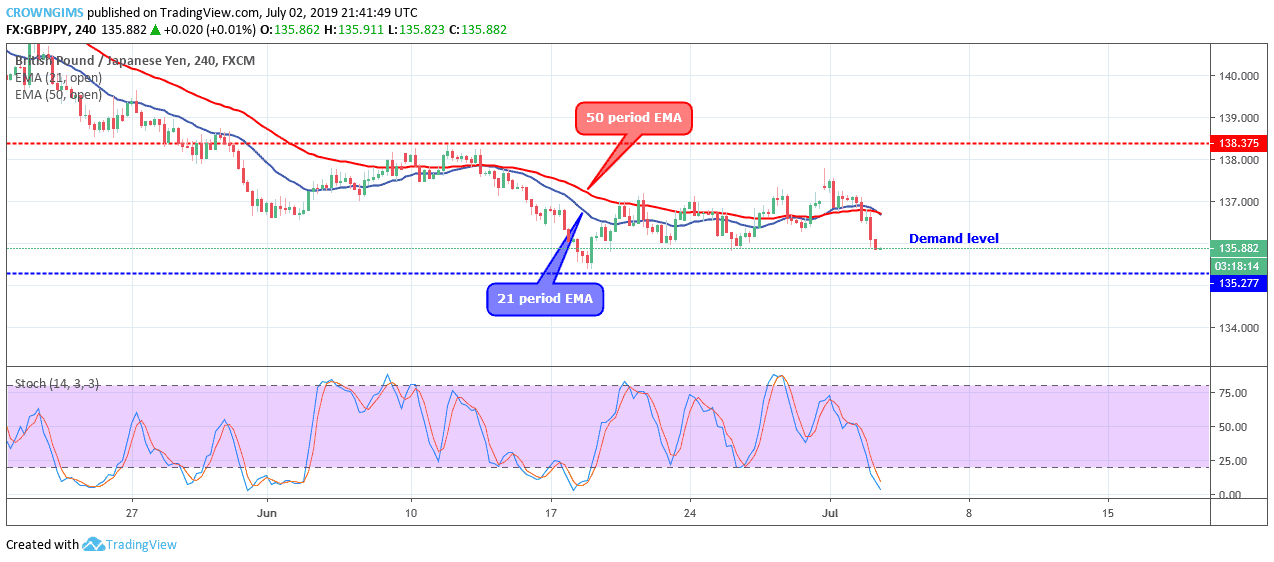
GBPJPY medium-term Trend: Bearish
On the medium-term outlook, GBPJPY is ranging. The Bearish momentum broke down the $138 former demand level on May 30 and the price was declined towards $135 level in which the mark was reached on June 18. A bullish engulfing candle formed pushed up the price but was resisted by the dynamic support and resistance; the pair started consolidating at the level.
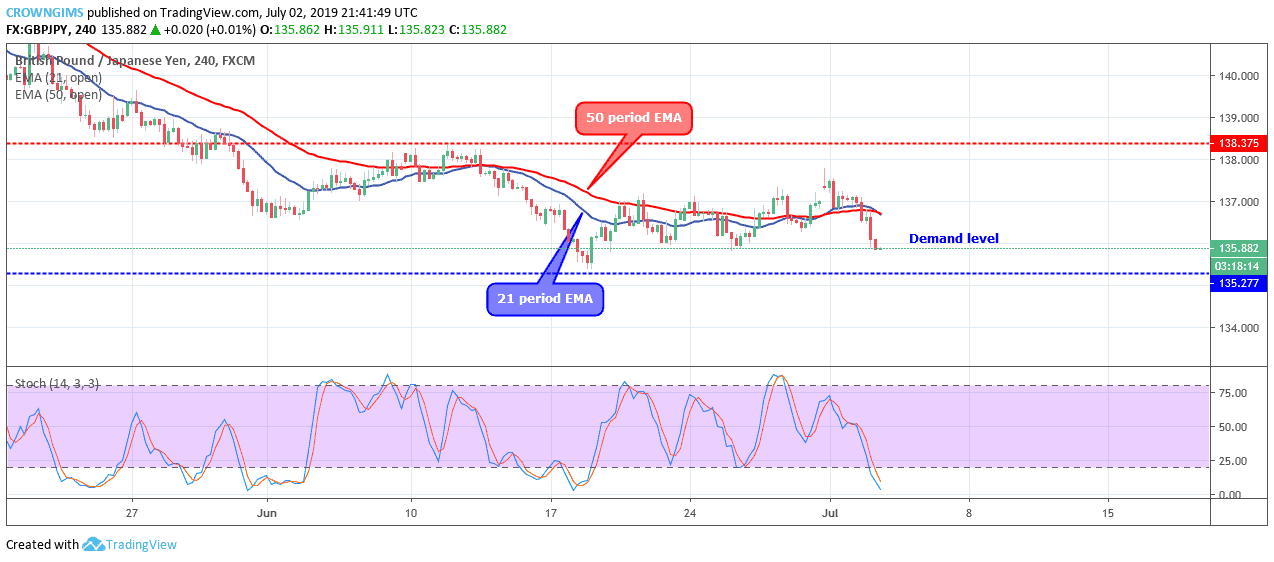
The currency pair continues hovering over the 21 periods EMA and 50 periods EMA. The Stochastic Oscillator period 14 is below 20 levels and the signal lines pointing down to indicate a sell signal.
Please note: insidebitcoins.com is not a financial advisor. Do your own research before investing your funds in any financial asset or presented product or event. We are not responsible for your investing results.
Read more:
- SOL Price: Further Decrease to $28 Level Envisaged, Bias on TAMA Is Upbeat
- Bitcoin Cash Price Prediction: BCH/USD Marks an Impressive Intraday Hike; Price Touches $231
Join Our Telegram channel to stay up to date on breaking news coverage