Join Our Telegram channel to stay up to date on breaking news coverage
XPTUSD Price Analysis – May 25
Further decrease in the price of the Platinum is highly envisaged as the two EMAs are bending to the bearish direction and there is no sign of weakness in the bearish momentum. The Bears may push the price down to the previous low at $776.
XPT/USD Market
Key levels:
Supply levels: $833, $898, $962
Demand levels: $776, $714, $657
XPTUSD Long-term trend: Bearish
On the weekly chart, XPTUSD is bearish. The strong massive weekly bearish candle broke out at the former demand level of $833 two weeks ago. The Sellers maintain their momentum and the platinum price declined further towards $776 level last week. The platinum is facing the demand level of $776.
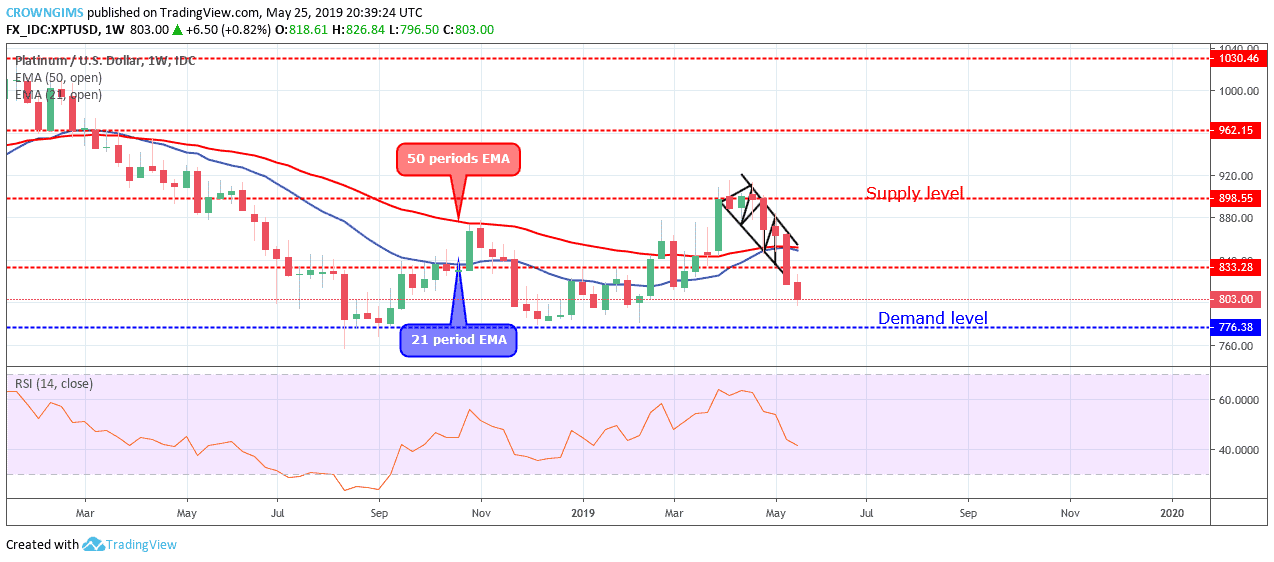
The distance between the price and the two EMAs are increasing; it is an indication of strong bearish momentum. Platinum is trading below the 21 periods EMA and 50 periods EMA, the Relative Strength Index period 14 is at 40 levels with the signal line pointing down to indicate sell signal. Further decrease in the price of the Platinum is highly envisaged as the two EMAs are bending to the bearish direction and there is no sign of weakness in the bearish momentum. The Bears may push the price down to the previous low at $776.
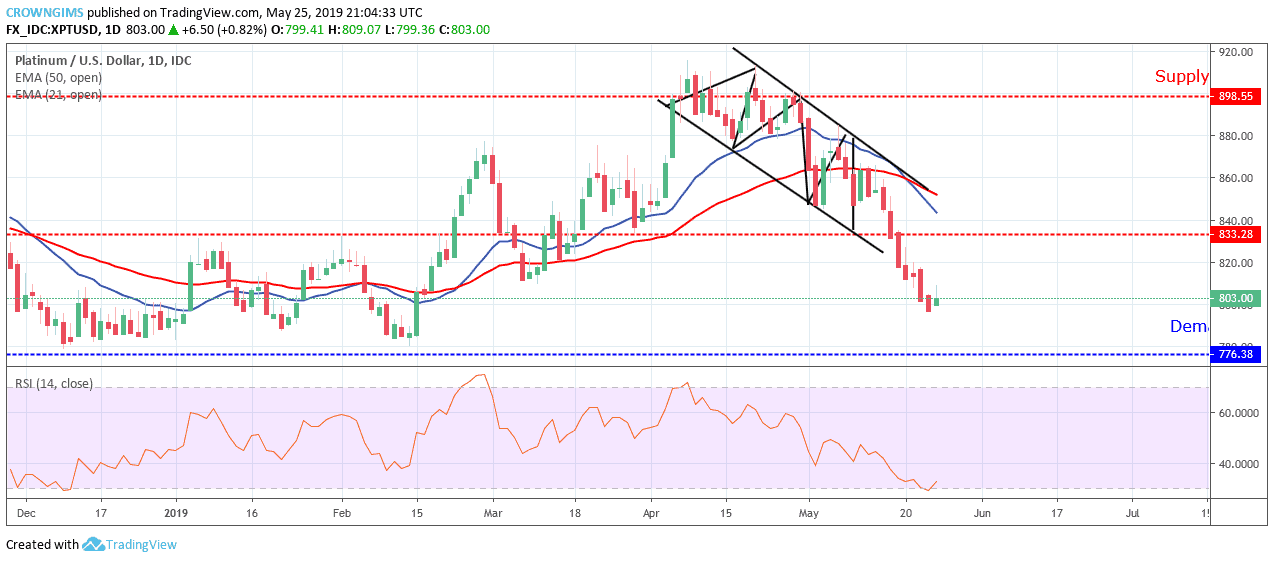
XPTUSD medium-term Trend: Bearish
XPTUSD is under bearish pressure on the medium-term outlook. After the breakout of the price from the descending channel, more daily bearish candles emerged and the price descended towards $776 level but not yet reaches the mark. On May 24, the market closed with a bullish candle on the daily chart; which signifies that the Bulls are gradually coming into the platinum market.
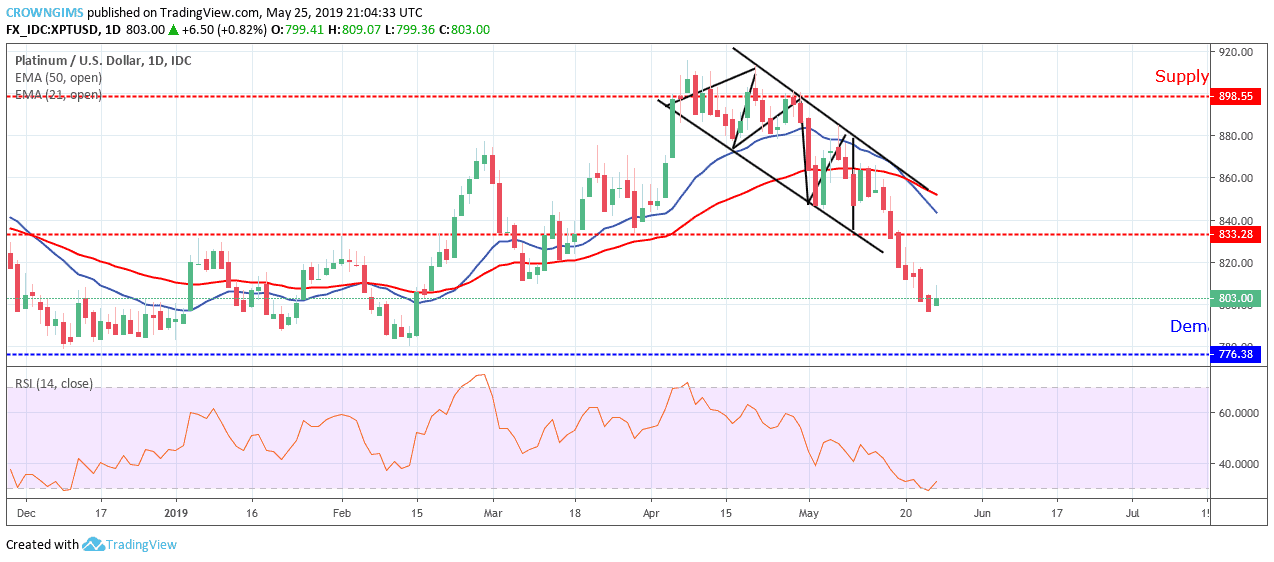
Platinum price is trading below the 50 periods EMA and 21 periods EMA which indicates a bearish movement in the Platinum market. The Relative Strength Index period 14 is at 20 levels and the signal lines bending up, which connotes buy signal.
Please note: insidebitcoins.com is not a financial advisor. Do your own research before investing your funds in any financial asset or presented product or event. We are not responsible for your investing results.
Join Our Telegram channel to stay up to date on breaking news coverage