Join Our Telegram channel to stay up to date on breaking news coverage
The Fantom price prediction shows that FTM remains in the green as the coin market gains 4.01% within the channel.
Fantom Prediction Statistics Data:
- Fantom price now – $0.412
- Fantom market cap – $1.27 billion
- Fantom circulating supply – 2.8 billion
- Fantom total supply – 3.1 billion
- Fantom Coinmarketcap ranking – #55
It’s often recommended to get involved in crypto projects as early as possible, as the growth potential can be significant. For instance, Fantom (FTM) has seen a remarkable increase from its all-time low price of $0.001953 on March 13, 2020. Since then, it has skyrocketed by an incredible 23,163.98%. Although it’s currently trading between $0.3892 and $0.4592, which is a significant drop from its all-time high of $3.48 on October 28, 2021, the impressive rise from its lowest point demonstrates the potential rewards of early investment in the crypto space.
FTM/USD Market
Key Levels:
Resistance levels: $0.58, $0.63, $0.68
Support levels: $0.25, $0.20, $0.15

FTM/USD price is currently exhibiting a bullish pattern on the daily timeframe, specifically within a descending channel. This pattern has been a focal point in previous analyses, and the coin’s price fluctuates within this channel. A new downtrend resistance has recently emerged, indicating that the coin must overcome this resistance before any potential breakout from the channel can occur.
Fantom Price Prediction: Fantom Could Break Short-Term Resistance
On a larger scale, the daily chart shows that the Fantom price has already broken out of a long-term descending channel. This significant breakout suggests the potential for a strong upward movement shortly. Moreover, the price’s behavior aligns with this, as it recently experienced a false breakout but managed to recover and is now heading toward key resistance levels of $0.58, $0.63, and $0.68, respectively.
Looking further ahead, if FTM/USD could break through the long-term resistance zone on the daily chart, which lies between $0.45 and $0.50, a substantial rally could follow. Meanwhile, this zone has previously acted as a critical support and resistance level, making it a significant barrier for the coin to overcome. Success in breaking this zone could lead to a strong and sustained price increase while any bearish cross below the 9-day and 21-day moving averages could lead the coin to the supports at $0.25, $0.20, and $0.15.
FTM/BTC Moves Higher
Fantom (FTM) could be set for an upward trajectory against Bitcoin if the recent bullish movement in the market continues, potentially pushing the price to cross above the upper boundary of the channel. In the event of a short-term bear market, the 530 SAT level and below might offer support for the next wave of selling pressure, particularly if the price dips below the 9-day and 21-day moving averages.
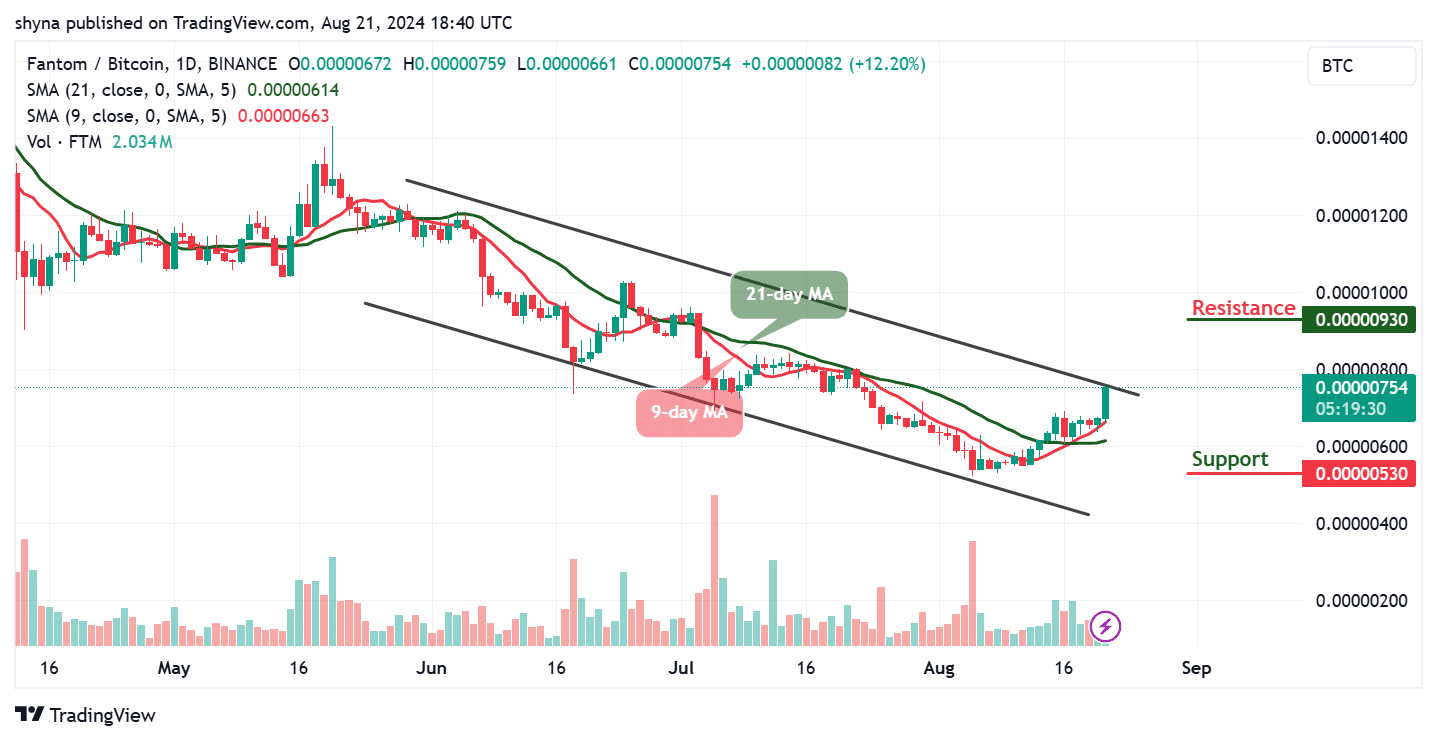
However, should the price touch the resistance level of 759 SAT, the bulls may take control and drive the market upward. If the 650 SAT support level holds firm against any downward pressure, we could see the resistance level of 930 SAT and higher come into play.
In addition, @CryptoJobs3 informed his 33k+ followers on X (formerly Twitter) that while the FTM price is consolidating well just below the main downtrend on the daily chart, there’s concern that a double top pattern might be forming on the H4 timeframe. He advised caution, suggesting that buying below the trendline and the $0.4100 mark may be risky. He anticipates a possible short-term rejection due to the double top, with the price potentially consolidating further and revisiting the $0.3750 – $0.3500 support zone. Additionally, there’s 50% Fibonacci support at $0.330. However, a breakout above the downtrend on the daily chart could trigger a surge toward the $0.4800 – $0.5000 range.
$FTM – price analysis: 📉
The price is consolidating nicely below the main downtrend daily, but I think that a double top is acting on the H4 view!
I wouldn't risk buying below the trend and the $0.4100 mark!⚠️
I expect a possible short-term rejection (double top)📉
The… pic.twitter.com/JjadZFUvZP
— 🧙 Crypto_Jobs🧙♂️ TA & FA 🎯 (@CryptoJobs3) August 21, 2024
Alternatives to Fantom
The Fantom price is at a critical juncture, with multiple resistance levels to watch closely. A successful breakout could lead to significant gains, potentially driving the price towards long-term targets between $0.50 and $0.60. Therefore, traders may need to monitor these developments and consider the potential for both short-term and long-term growth in Fantom Coin’s value. Meanwhile, PlayDoge, a play-to-earn (P2E) mobile game inspired by Tamagotchi, is in the final six days of its pre-sale, which is set to conclude on August 26, 2024. The project has successfully raised over $6.12 million, with a target of $6.735 million looking attainable before the deadline. This fundraising milestone comes after nearly three months of pre-sale activity, during which PlayDoge’s development progressed faster than expected, prompting an earlier conclusion to the pre-sale.
PlayDoge Enters Final Days of Sellout Presale
With the PlayDoge pre-sale ending on August 26, 2024, now is the ideal time to invest in this promising play-to-earn game. The project has already raised over $6.12 million, with tokens available at $0.00531 each. By investing now, you can secure a position in an innovative game poised for success in the crypto gaming market.
Related News
- Fantom Price Prediction: FTM The Top Performer After 10% Surge, But Experts Say Consider This P2E Crypto For Exponential Gains
- PlayDoge Enters Final 6 Days Of Sellout Presale, Unveils More P2E Game Footage
Join Our Telegram channel to stay up to date on breaking news coverage