Join Our Telegram channel to stay up to date on breaking news coverage
EURCHF Price Analysis – July 10
The bullish trend will continue only when the Bulls break up the confluence at $1.116 level. Should the Bears defend the $1.116 level consolidation may continue.
EUR/CHF Market
Key levels:
Resistance levels: $1.116, $1.126, $1.133
Support levels: $1.110, $1.105, $1.098
EURCHF Long-term trend: Ranging
EURCHF is on the sideways movement on the long-term outlook. The currency pair has not made any significant movement on the daily chart. It has been range-bound within $1.110 and $1.116 price levels. Throughout last week, the pair was moving sideways within this range. On the daily chart, the momentum of today’s market is low.
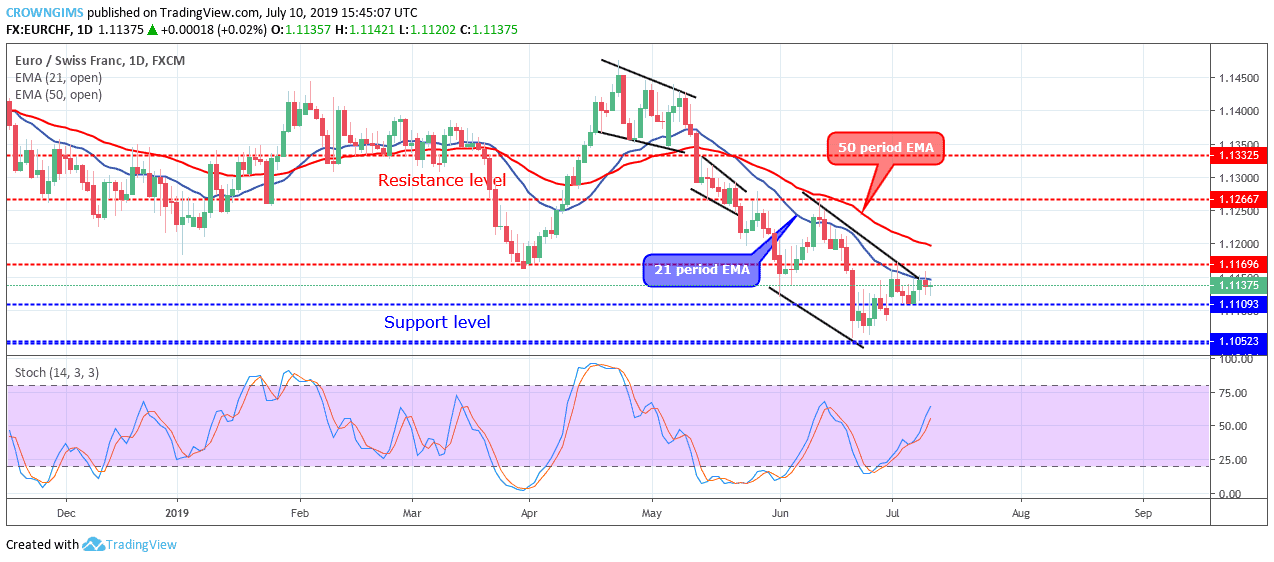
EURCHF price maintains its trading below the 21 periods EMA and 50 periods EMA at a close range to the EMAs which indicates low bullish momentum. However, the Stochastic Oscillator period 14 is above 50 levels with the signal lines pointing up to indicate a buy signal. The bullish trend will continue only when the Bulls break up the confluence at $1.116 level. Should the Bears defend the $1.116 level consolidation may continue.
EURCHF medium-term Trend: Bearish
EURCHF is ranging on the medium-term outlook. The sideways movement commenced on the 4- hour chart on July 02 after the price reached the resistance level at $1.116. The Bears returned the price to the support level of $1.112. Both the Bear and the Bulls lost momentum and the price started consolidating within the $1.116 and $1.112 levels.
The 21 periods EMA is interlocked with 50 periods EMA and the price is trading directly on the two EMAs.
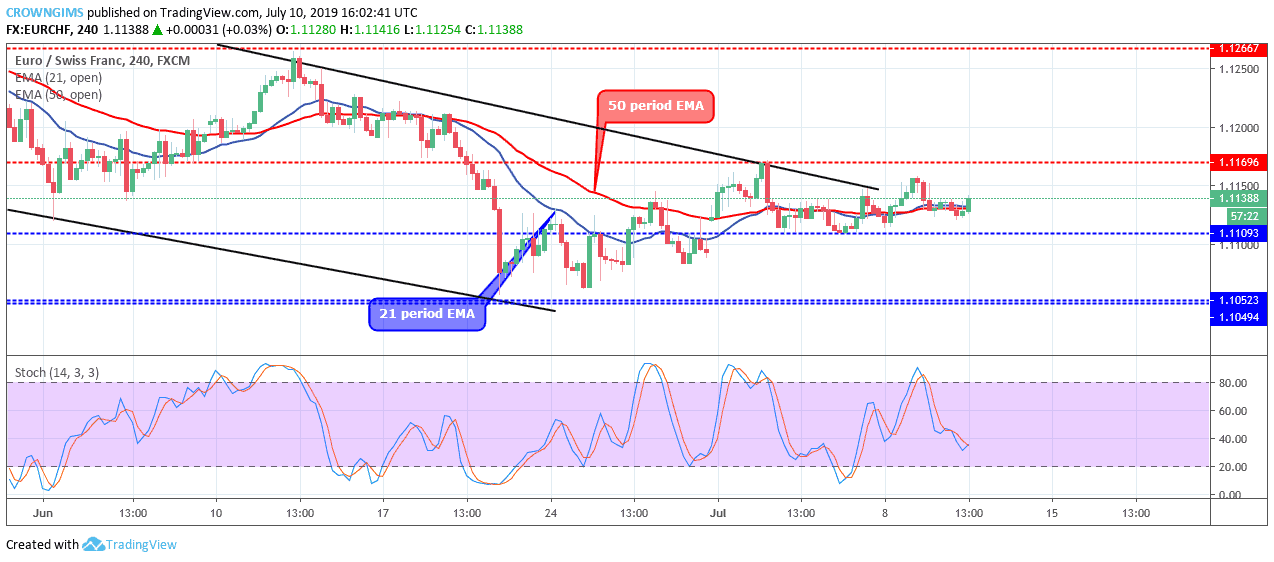
Nevertheless, the Stochastic Oscillator period 14 is below 40 levels and the signal lines bending down to indicate that the price may reduce.
Please note: insidebitcoins.com is not a financial advisor. Do your own research before investing your funds in any financial asset or presented product or event. We are not responsible for your investing results.
Read more:
- Ethereum Price Prediction: ETH/USD Marks Slight Recovery, Is $200 in Sight?
- Price Forecast of XRP: Should You Buy XRP Now as the Legal Conditions are in Ripple’s Favor?
Join Our Telegram channel to stay up to date on breaking news coverage