Join Our Telegram channel to stay up to date on breaking news coverage
ETH Price Prediction – February 20
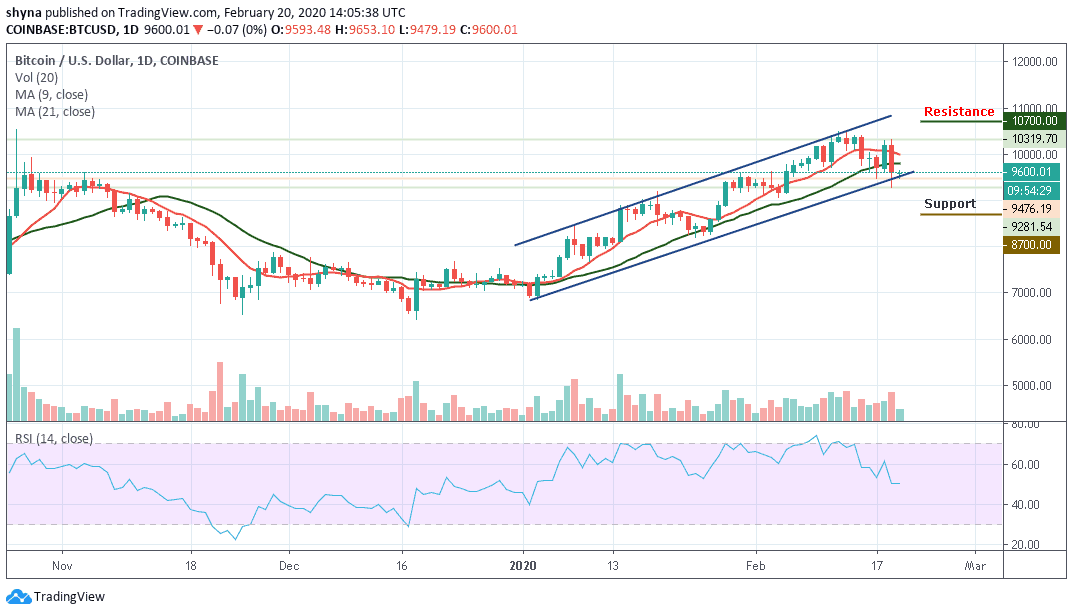
The price of Ethereum is approaching a crucial support level, similar to Bitcoin. The coin must hold the $260 support to climb towards $280.
ETH/USD Market
Key Levels:
Resistance levels: $305, $310, $315
Support levels: $215, $210, $205
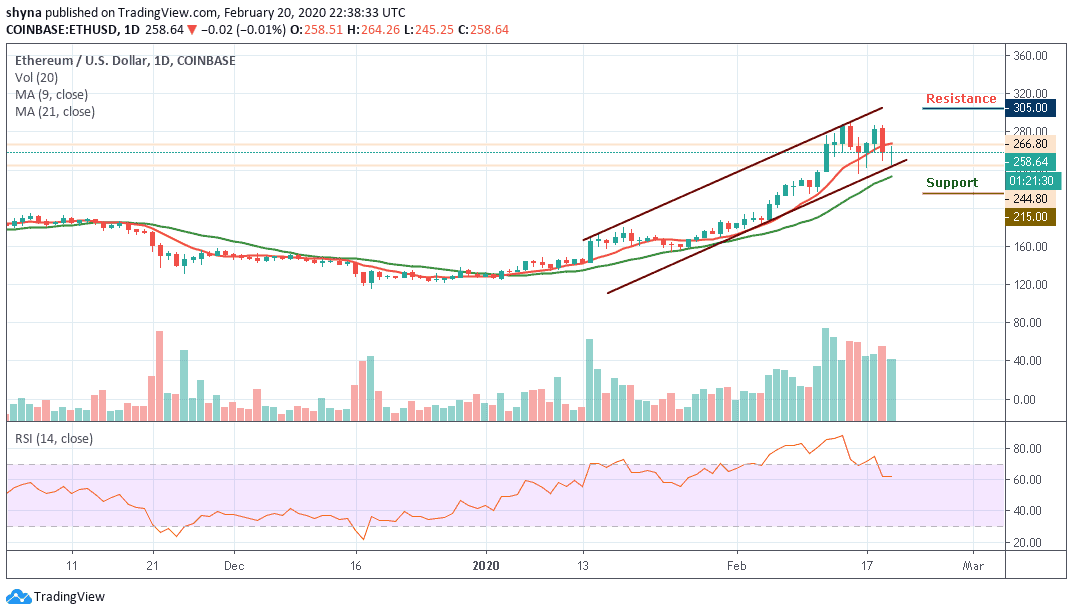
At the time of writing, ETH/USD is trading down 0.01% at its current price of $258.64, which marks a notable decline from its daily high of $266 that was set today when the bulls attempted to spark another rally. In the near-term, ETH/USD has been able to find some support in the lower $244 level, as it has bounced multiple times after visiting this level.
However, the price to buy Ethereum was bitten today by the bear. ETH/USD may be experiencing a price drop as many traders were expecting a lot from the coin. The price is currently moving under the 9-day and above the 21-day moving averages which are yet to break out to the upside or downside of the channel.
Moreover, a bearish drop may likely roll the market down to the support level of $215, $210 and $205 while possible bullish surge may drive the market above the 9-day moving average to $280 level, while testing the upper channel boundary, the $305, $310 and $315 may further provide resistance levels for the market. The RSI (14) moves above 60-level and staying there could cause the coin to remain above the $258 support level.
Against Bitcoin, we can see that the Ethereum price is trying to climb towards the support transformed into resistance. Until this resistance is overcome and the price does close above the upper limit of the channel, there is no reason to expect a long-term bullish reversal.
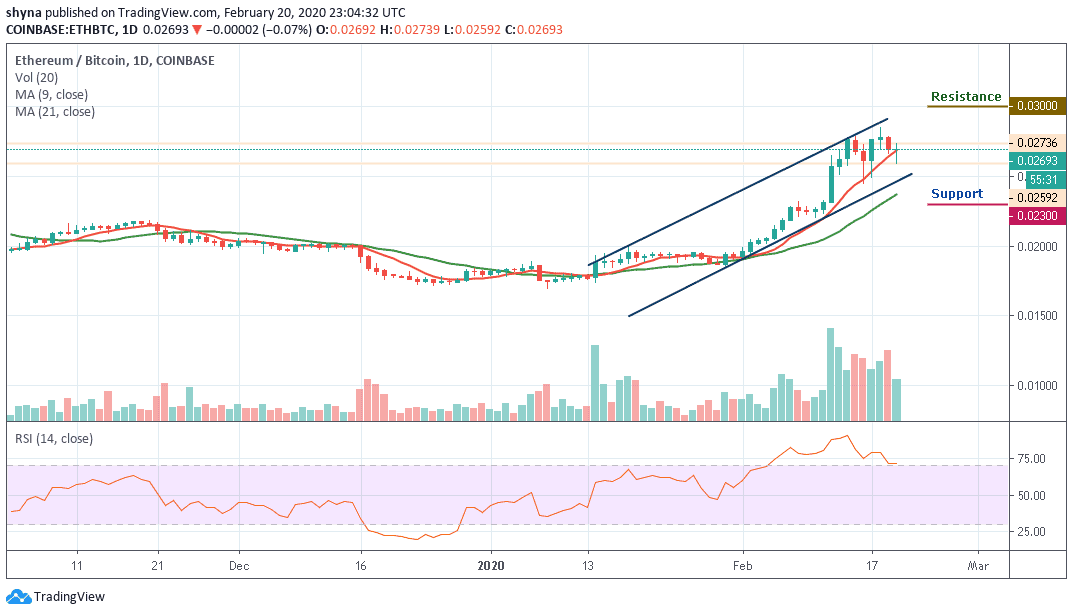
Meanwhile, a potentially bearish pullback could meet significant support at the 2500 SAT before falling back to 2300 SAT and 2100 SAT, while buyers may likely push the market towards the potential resistance of 3000 SAT and above. The RSI (14) moves within the overbought zone where a bearish cross could reduce the market to the lower levels.
Please note: Insidebitcoins.com is not a financial advisor. Do your research before investing your funds in any financial asset or presented product or event. We are not responsible for your investing results.
Join Our Telegram channel to stay up to date on breaking news coverage