Join Our Telegram channel to stay up to date on breaking news coverage
ETH Hovers at $1,250– November 19
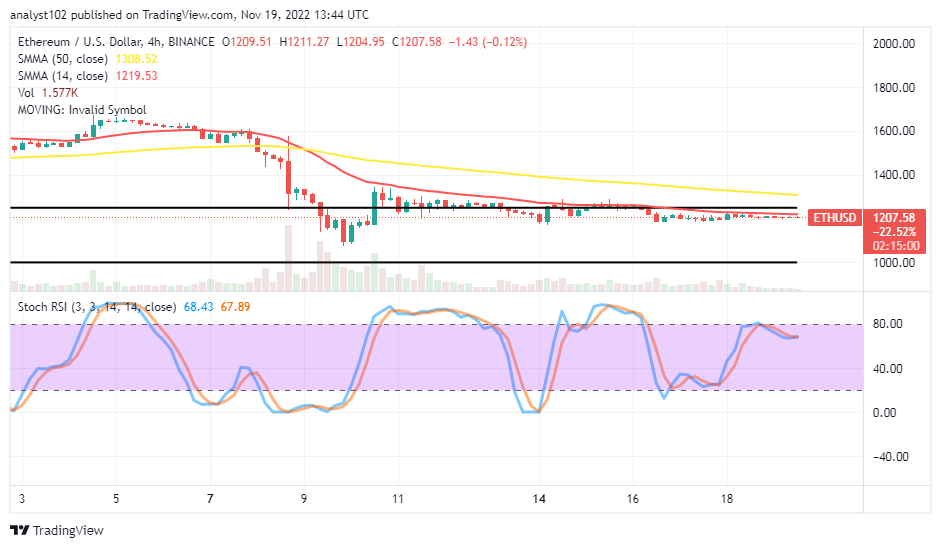
Reactions of the ETH/USD trade sellers have led to an outlook that the crypto market hovers at the $1,250 value line. There have been feeble bearish-trading stances between $1,211.97 and $1,197.09 at an average minute negative percent of 0.37.
ETH Hovers at $1,250: ETH Market
Key Levels:
Resistance levels: $1,250, $1,500, $1,750
Support levels: $1,100, $1,000, $900
ETH/USD – Daily Chart
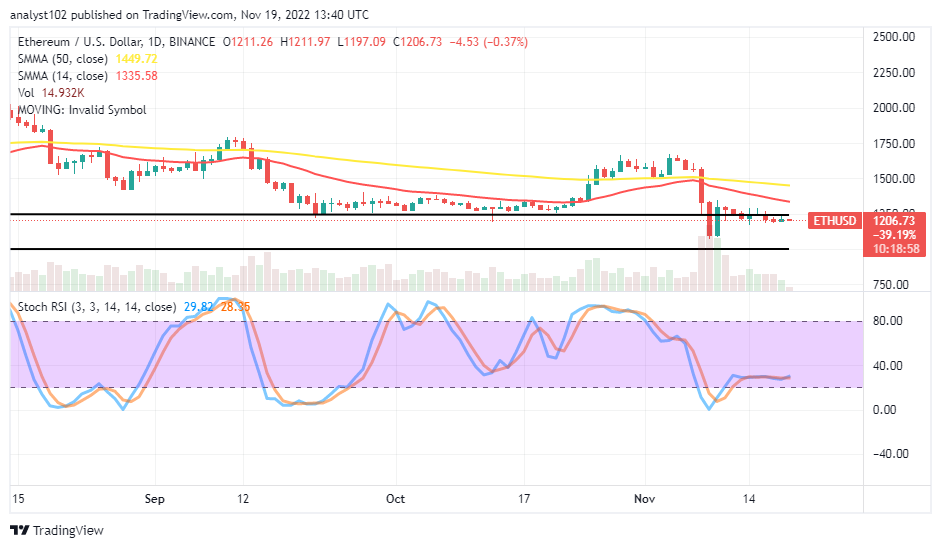
The ETH/USD daily chart pictures that the crypto market hovers at the $1,250 trading resistance level over a couple of days’ sessions. The 14-day SMA indicator is at $1,335.58, underneath the $1,449.72 point of the 50-day SMA indicator. The upper and lower horizontal lines denote the zones in which the price has featured. The Stochastic Oscillators are moving in a consolidation manner around 28.35 and 29.82 levels to indicate less action is taking place in the market.
Should ETH/USD market participants anticipate the hovering position in the following operations in a continuation mode?
There is potency that the ETH/USD traders will witness fluctuations around the subsequent transactions as the crypto market hovers at the $1,250 level. The value line appears, turning into a key point that the market has to fearfully push past to the upside to achieve a fresh cycle of bullish trend resumption. The two horizontal lines have resulted in zones where the activities to confine for some time. A bounce-off from the lower area to the higher line will allow purchasers to recoup some lost valuations.
On the negative side of technical analysis, it has been that the ETH/USD trade operation is presently operating within clear range-bound setting zones. The $1,250 and $1,000 levels fave depicted by horizontal lines drawn as bears need to solidify their stances against the possibility of bulls’ chance, attempting to push northward away from the higher trading spot. Before establishing a sell-order position, short-position placers should wait for active forces to emanate around the upper horizontal line.
ETH/BTC Price Analysis
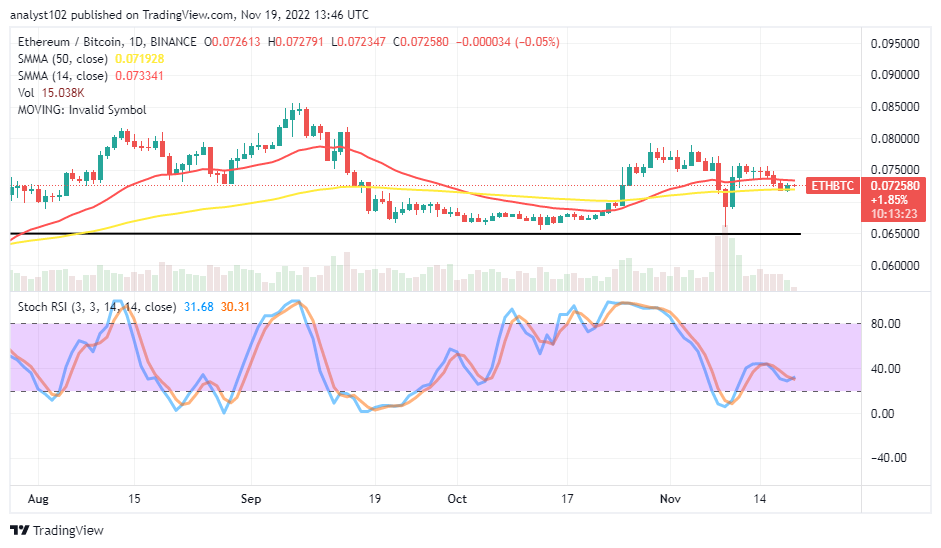
Ethereum has resorted to a light correction against the trending capacity of Bitcoin. The cryptocurrency pair market hovers at the trend lines of the SMAs with less probability chance to going deep long to the downside. The 14-day SMA indicator is closely over the 50-day SMA indicator. The Stochastic Oscillators are around 40 and 20 points, seemingly attempting to cross back northbound at 30.31 and 31.68 levels. That signifies that the base crypto is striving to make an upward swing against the counter-trading crypto.
Being as it is, the collapse of FTX brings about a need for a cutting-edge trading intelligence platform, and that exactly is what Dash 2 Trade offers. It is a platform that can adequately detect impending adverse issues similar to what happened to FTX, thus enabling investors and traders to pinpoint safe opportunities for good profits. The D2T token presale is ongoing and it has raised $6.5 million so far.
Related
Join Our Telegram channel to stay up to date on breaking news coverage
