Join Our Telegram channel to stay up to date on breaking news coverage
Ethereum Price Prediction – February 5
The Ethereum price prediction shows that ETH is moving higher and above the main barrier of $3900 as the coin stays higher.
ETH/USD Market
Key Levels:
Resistance levels: $3500, $3700, $3900
Support levels: $2500, $2300, $2100
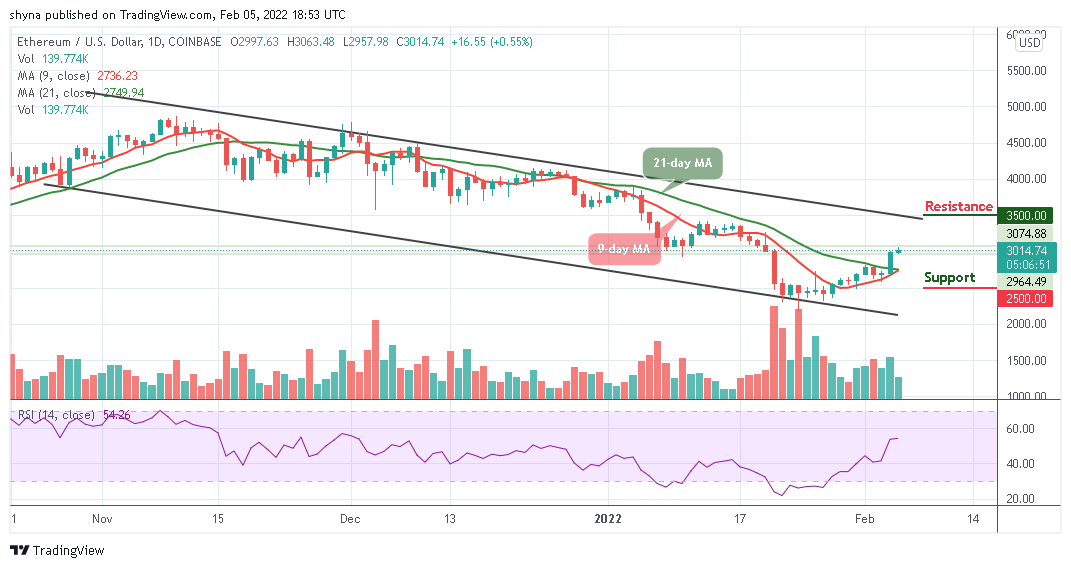
ETH/USD keeps the bullish movement as the coin breaks higher. At the time of writing, the Ethereum (ETH) is making a gain of almost 0.55% and touches the daily high of $3063. However, the second-largest crypto is managing to keep its price above the 9-day and 21-day moving averages. Meanwhile, traders can expect Ethereum to prepare itself steadily for a ride towards $4000.
Ethereum Price Prediction: ETH Price Ready for the Upside
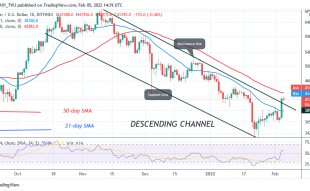
In the last few days, Ethereum price has moved from $2358 to $3063 and at the same time moving towards the upper boundary of the channel. However, the ongoing trend may move a little bit higher in the coming week if the 9-day moving average crosses above the 21-day moving average as the coin may reach the nearest resistance at $3200, therefore, any further bullish movement could hit additional resistance levels at $3500, $3700, and $3900 respectively.
However, a bearish drop below the moving averages may roll the market back below the moving averages and to the initial support level of $2600. Meanwhile, the support levels could be located at $2500, $2300, and $2100. As the trading volume increases, the technical indicator Relative Strength Index (14) moves around 55-level which indicates that more bullish signals may come to play.
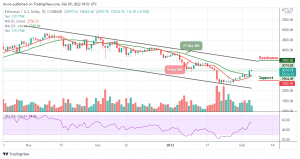
When compares with Bitcoin, Ethereum is currently trading above the 9-day and 21-daymoving averages. The price is changing hands at 7241 SAT as the technical indicator Relative Strength Index (14) moves above 50-level. However, the daily chart reveals that the coin is retreating after touching the daily high of 7319 SAT.
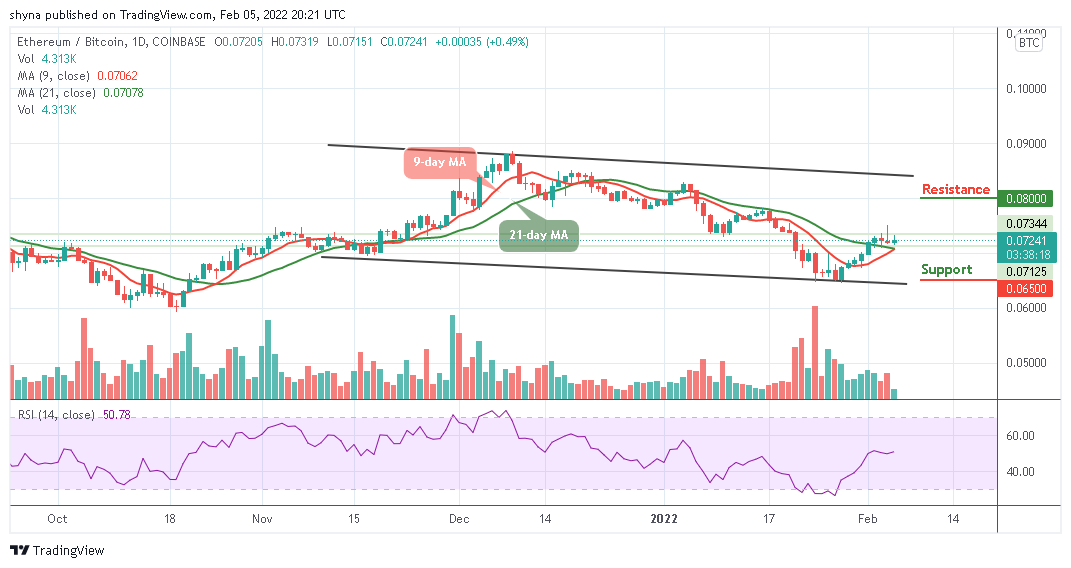
Negatively, the critical support levels are located at 6500 SAT and below. Inversely, a higher sustainable move may likely attract new buyers to the market with the next resistance at 8000 SAT and above.
Looking to buy or trade Ethereum (ETH) now? Invest at eToro!
68% of retail investor accounts lose money when trading CFDs with this provider
Join Our Telegram channel to stay up to date on breaking news coverage