Join Our Telegram channel to stay up to date on breaking news coverage
Ethereum Price Prediction – March 28
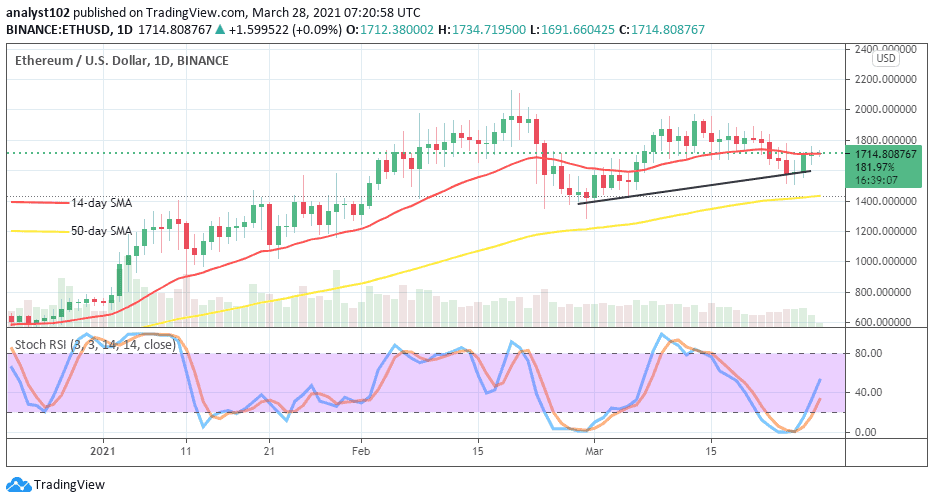
After a long bullish reversal move in the ETH/USD trade operations, the crypto has appeared to have weakly found support around the level of $1,500 as price trades closely towards the north below the resistance point of $1,800.
ETH/USD Market
Key Levels:
Resistance levels: $1,900, $2,100, $2,300
Support levels: $1,500, $1,300, $1.100
ETH/USD – Daily Chart
A critical support level seems to have been depicted as there has been a formation of about two candlesticks having lower pins with one bottom-shadow trading candlestick that has occurred against the 14-day SMA trend-line to the north. The two SMAs are of pointing towards the north than any other direction. And, yet, the 50-day SMA is underneath the smaller 14-day SMA. The Stochastic Oscillators have crossed from the oversold region to point to the north at range 40. That signals a promising potential in a favor of an uptrend in the loom.
Will ETH/USD trade swings past its 14-day SMA trend-line at the $1,700 mark?
Currently, there is a low-active market move around the point of $1,700. The ETH/USD bulls are trying to relocate their stand in this crypto-trade. Meanwhile, a vital point has been touched to leave a chance for a possible rebound that may feature series of ups beyond the resistance level of $1,800 in a near trading session. In a heavy volatile move, there may be a quick price reversal around the peak of the $2,200 mark.
On the downside, the ETH/USD bears need to watch out for a pit stop and rejections of an active price move around the resistance line of $1,900 before considering a sell order. However, if those two assumptions not visible at that trading level, there’ll be a need to patiently await the session that will play out in an upper trading zone of the market. Also, traders contemplating selling entry have to be cautious of their decision every time they launch their positions.
ETH/BTC Price Analysis
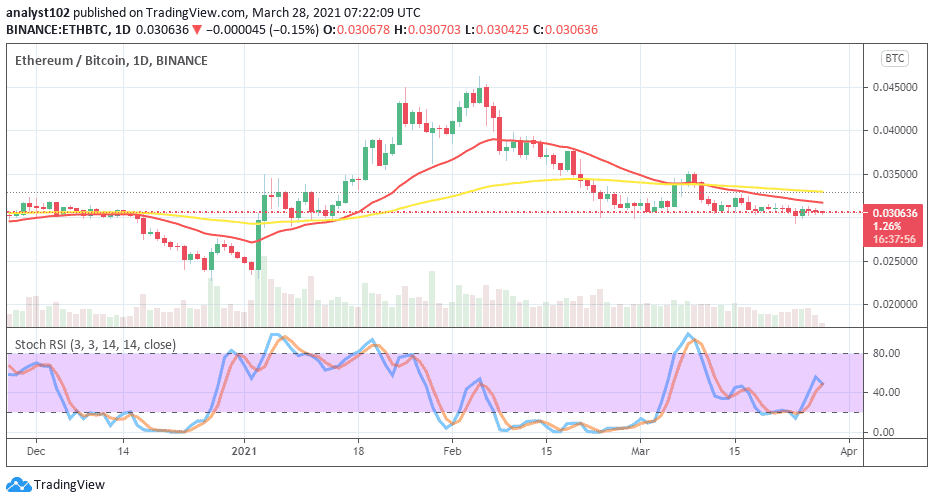
To some reasonable extent as of now, Ethereum, as the base-crypto in the look against Bitcoin as the counter-crypto is yet to recover from a selling pressure inflicted on it over time. However, the counter-crypto has held the value of the base-crypto very tight closely around a long lowly-kept line to feature lower lows until the present time of trading. The two SMA trading indicators are located over the trading tools’ value. The 50-day SMA has been intercepted from the top by the 14-day SMA with a small space between them. The stochastic oscillators have placed between ranges of 20 and 40. They now appear to have closed the hairs at the upper range. That signifies either a consolidation move is about to start or the coming of more potential downs.
Join Our Telegram channel to stay up to date on breaking news coverage


