Join Our Telegram channel to stay up to date on breaking news coverage
ETH Price Prediction – July 24
The Ethereum steady bullish action breaks above the $280 barrier; although, eyes currently glued on $300.
ETH/USD Market
Key Levels:
Resistance levels: $315, $310, $315
Support levels: $245, $240, $235
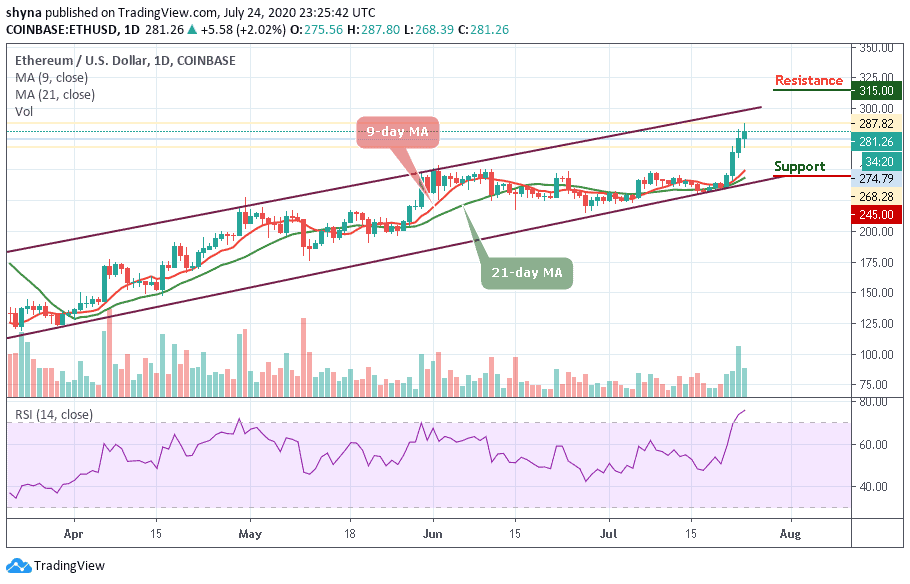
According to the daily chart, ETH/USD is seen refreshing to a new high for the past 24 hours and breaches above $284 at $286 while currently trades at $281 with a bullish crossover and trend in the intraday. At the time of writing, ETH/USD has adjusted to $281. Higher support at $285 is expected to be a stepping stone for a comeback past $287 and the majestic rally eyeing $300 resistance level.
However, the cryptocurrency market has generally turned red, especially for larger digital cryptos, including Bitcoin, which rose to $9,600 after testing $9,700. For Ethereum, parallel trade can only take over if the $270 subsidy is maintained at all costs. Currently, RSI is holding above 70 at the moment. Unfortunately, it sends the opposite signals which can finally encourage more sellers to enter the market.
Therefore, as long as the red-line of 9-day MA is above the green-line of 21-day MA, the coin may continue to do well and the price could hit the resistance levels at $315, $320, and $325 respectively. Meanwhile, should the technical indicator decide to make a quick turn back to the lower side, there may be a quick bearish drop which may likely roll the market down to the support levels of $245, $240, and $235.
Against BTC, Ethereum is still trading above the upper boundary of the channel and the price is now hovering at 2928 SAT as the technical indicator RSI (14) trades within the overbought zone. For the fact that the bulls remain the dominant of the market, the pair seems to be moving above the upper boundary of the channel.
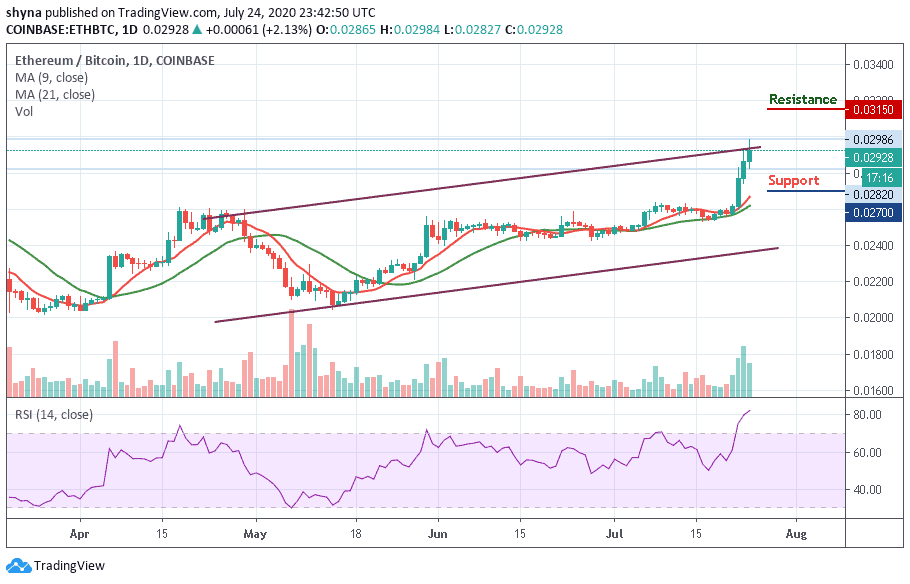
At the upside, the resistance levels to be reached are 3150 SAT and 3200 SAT. In other words, a lower sustainable move may likely cancel the bullish pattern and this could attract new sellers coming into the market with the next focus on 2700 SAT and 2600 SAT support levels.
Join Our Telegram channel to stay up to date on breaking news coverage