Join Our Telegram channel to stay up to date on breaking news coverage
ETH Price Prediction – January 17
Ethereum bulls push strongly through the $170 resistance but still fall short of $175.
ETH/USD Market
Key Levels:
Resistance levels: $185, $190, $195
Support levels: $142, $137 $132
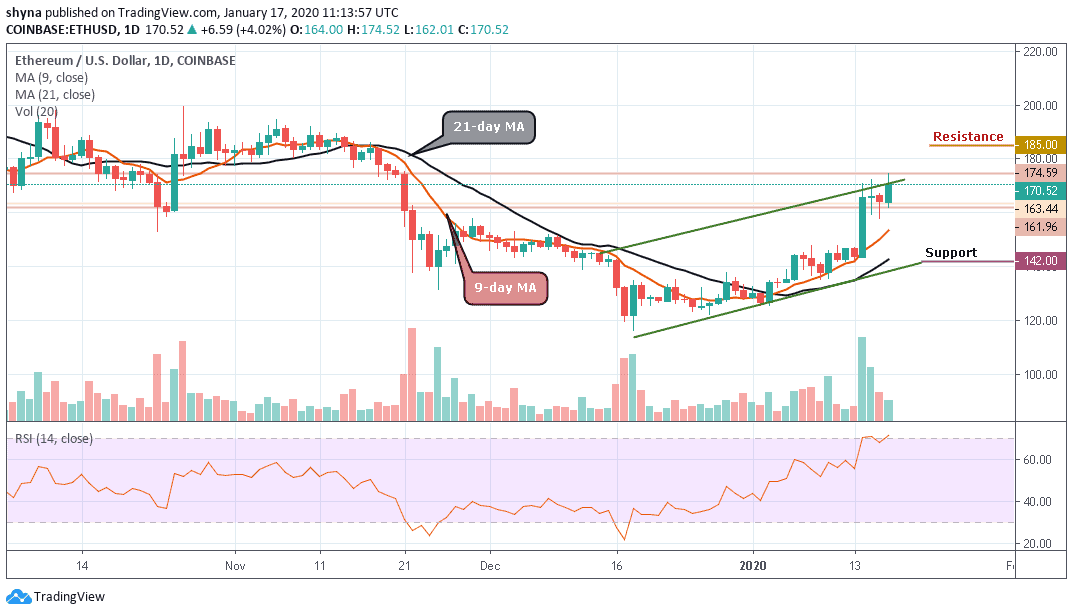
The recent bullish action of ETH/USD failed to sustain gains above $170 level, although a high was achieved at $174.59. For a couple of days, Ethereum consolidated the accrued gains between $165 and $170 but the bullish wave across the board today placed ETH/USD on a recovery trajectory, pulling the price above the critical $170 level.
Currently, Ethereum is trading at $170.52 after adding 4.11% onto its value on the day. The strength of the coin is opening the door for a massive recovery movement targeting $200. Meanwhile, the critical resistance at $175 must come down to pave the way for the impending action. From a technical perspective, ETH/USD is capable of tackling the hurdles towards $200 as the RSI (14) shows that the crypto is not yet overbought. Therefore, the bulls still have room for growth in the short term.
Moreover, the Ethereum price is gaining bullish momentum from the $160 support as the price surged above the $168 and $170 resistance levels. It seems like the bulls are now aiming a clear break above the $175 and $178 levels in the coming sessions. If they are successful with the break, the resistance levels of $185, $190 and $195 may come into play.
On the downside, the previous resistance near $166 is likely to act as a buy zone but if there is a fresh decline below this level, the bulls are likely to struggle to hold the $155 support. So, in the event a reversal ensues, traders should be alert for various support levels including $150 and $145. Other key support levels include $142, $137 and the critical $132.
Against Bitcoin, the market price remained in the ascending movement since January 9, currently trading at the level of 1910 SAT and expecting a break out above the channel. Looking at the daily chart, we can see that the bulls continue to take control of the market. If the bulls continue to control the market, the next key resistance levels may likely come at 2000 SAT and above.
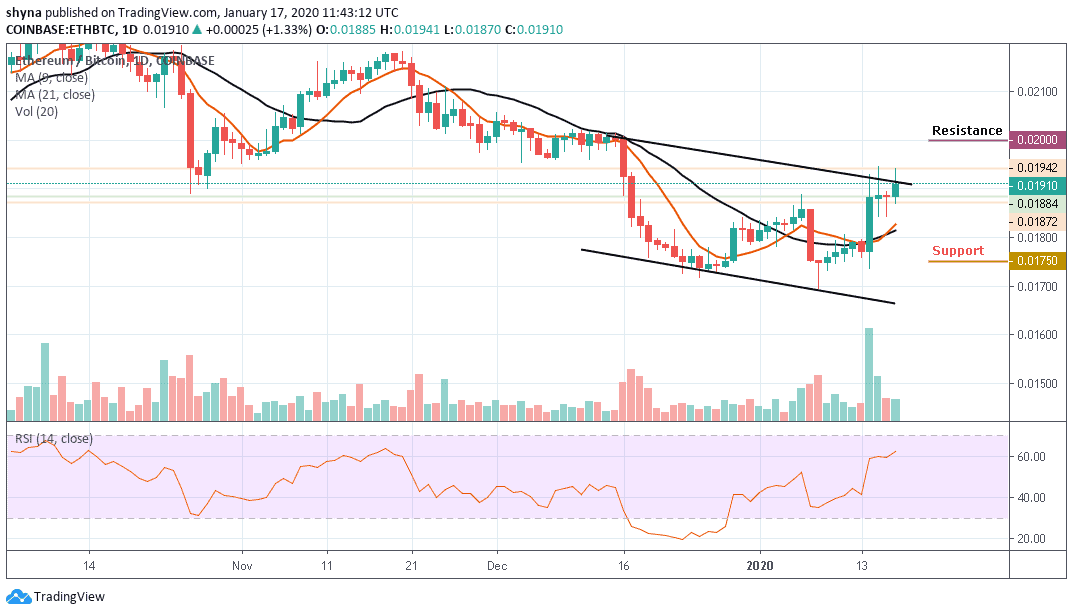
However, on the downside, a possible drop could bring the market below the 9-day and 21-day moving averages which may visit the support levels of 1750 SAT and 1650 SAT. According to the RSI (14), the signal line faces an upward trend, which could trigger more bullish signals in the market soon.
Please note: Insidebitcoins.com is not a financial advisor. Do your research before investing your funds in any financial asset or presented product or event. We are not responsible for your investing results.
Join Our Telegram channel to stay up to date on breaking news coverage