Join Our Telegram channel to stay up to date on breaking news coverage
ETH Price Prediction – January 14
Ethereum price moves to break the $160 resistance level as the coin maintains its upward movement.
ETH/USD Market
Key Levels:
Resistance levels: $180, $185, $190
Support levels: $140, $135 $130
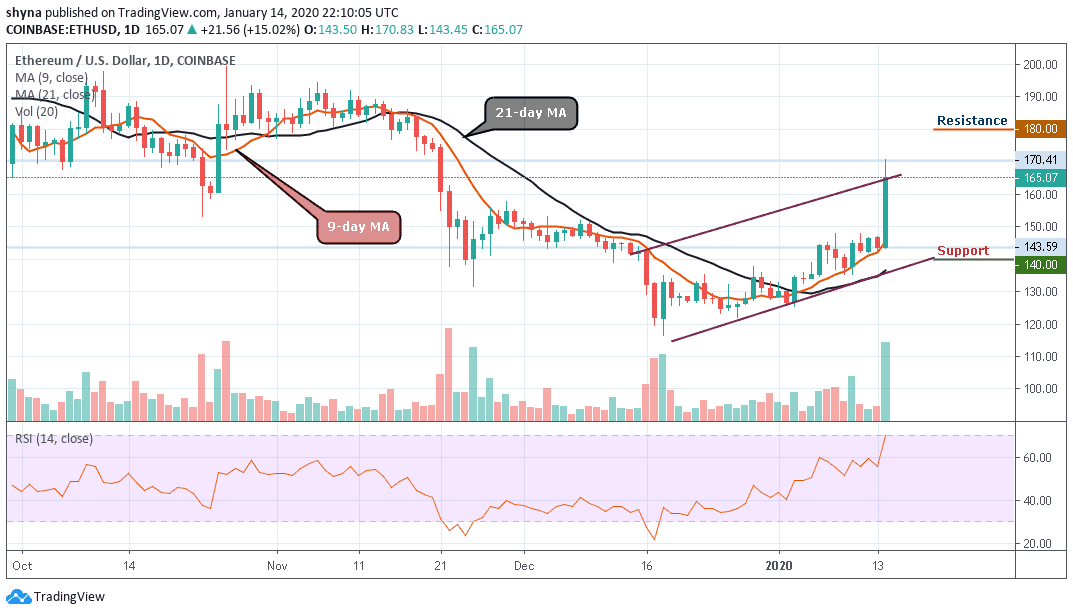
ETH/USD is currently trading 15.02% higher on the day following widespread recovery movements across the board. The stubborn selling activity at $143 was smashed this time, allowing Ethereum to jump above $170. However, the trend became unattainable, forcing the bulls to take a step back to the market value at $165.07. The former resistance at $150 is currently working as the immediate support.
However, the technical picture remains positively intact with the RSI (14) facing the overbought territory. The buyers have no choice but to break the $165 barrier. The move will not only allow them to focus on $170 but also it will remove the risk of plunging back to the support at $150. Other key support areas include $140, $135 and $130.
In addition to that, the lower boundary trend line of the ascending channel is in line to offer support if a reversal occurs. On the upside, the on-going trend may move a little bit higher this week, and the coin may likely cross the upper boundary of the channel to re-test the nearest resistance at $170, but if the bulls put more effort, it could hit additional resistance levels at $180, $185 and $190 respectively.
When compared with BTC, although the market price remained in the descending channel since November 19, 2019, currently trading at the level of 1873 SAT and expecting a break out above the channel. Looking at the statistics from top 5 forex brokers, we can see that the bulls continue to push the price to the north. If the market continues to rise, it may likely reach the resistance level of the 1950 SAT and above.
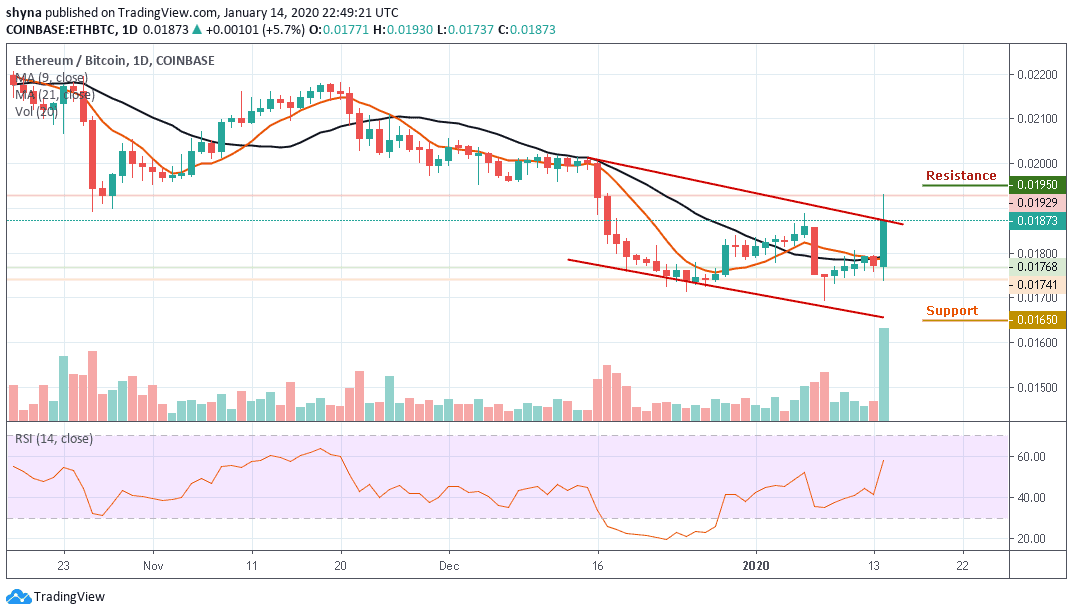
Furthermore, on the downside, a possible drop could bring the market below the moving averages of 9 and 21 days which may visit the support levels of 1650 SAT and 1600 SAT. According to the RSI (14), the market faces an upward trend, which could trigger more bullish signals in the market soon.
Please note: Insidebitcoins.com is not a financial advisor. Do your research before investing your funds in any financial asset or presented product or event. We are not responsible for your investing results.
Join Our Telegram channel to stay up to date on breaking news coverage