Join Our Telegram channel to stay up to date on breaking news coverage
Ethereum Price Prediction – May 3
The market worth of ETH/USD has been skyrocketing trading past some new higher resistant levels. As of writing, price continues waxing stronger against the trade valuation of the US Dollar in the market.
ETH/USD Market
Key Levels:
Resistance levels: $3,500, $3,700, $3,900
Support levels: $2,700, $2,500, $2,300
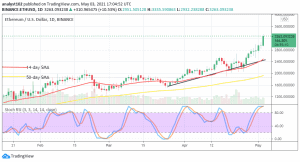
ETH/USD – Daily Chart
Since April 26 while a bullish candlestick suddenly occurred on the buy signal side of the smaller SMA, the following features of candlesticks have been on a serial outlook denoting a kind of northward straight-line path on the ETH/USD daily chart. The bullish trend-line is drawn closely along with the 14-day SMA trend-line above the 50-day SMA indicator. The Stochastic Oscillators are in the overbought region with the hairs closed. That suggests that the current uptrend may soon be approaching a strong trading resistance that the crypto will have to be less active in the near session.
Will there soon be a pit stop in the ETH/USD current visible upswing?
The indication as of now still stronger in favor of the ETH/USD bulls as they appear to possess all the domineering momentum to still push northwardly against the US Dollar. However, an abrupt price reversal against a support level of $2,900 will potentially mean a nullification warning signal against the continuation of the presently experienced upswing.
As regards analyzing the return of a downward price movement of this crypto-market, it would technically okay that bears needed to await a formation of bearish candlestick engulfing about two immediate bullish ones to be able to know a sell entry point while that assumption comes to play out. In the light of that, market lines between the $3,200 and the $3,600 are so much expected to be tougher resistance trading zone of the crypto afterward.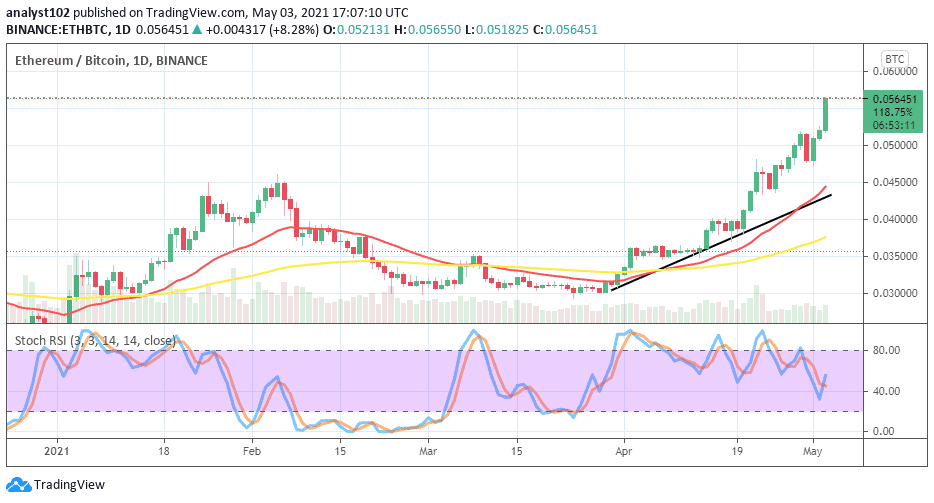
ETH/BTC Price Analysis
Taking a look at the market purchasing power between ETH and BTC in comparison, it is clear that the counter instrument has been underpriced by the base crypto. The ETH market valuation has evenly been mooning far away on the buy signal side of the smaller SMA. The bullish trend-line and the 14-day SMA trend-line are located over the 50-day SMA indicator. The Stochastic Oscillators have in a struggling moving manner placed downward around range 40 from the overbought region. But, they now slightly cross the hairs towards the north to denote a promising continuation of more ups in favor of the base crypto against the market trading worth of the flagship countering instrument.
Join Our Telegram channel to stay up to date on breaking news coverage