Join Our Telegram channel to stay up to date on breaking news coverage
ETH Price Prediction – December 27
ETH/USD price action continues to move within a bearish nature, forming technical patterns for moves to the south.
ETH/USD Market
Key Levels:
Resistance levels: $140, $150, $160
Support levels: $110, $100, $90

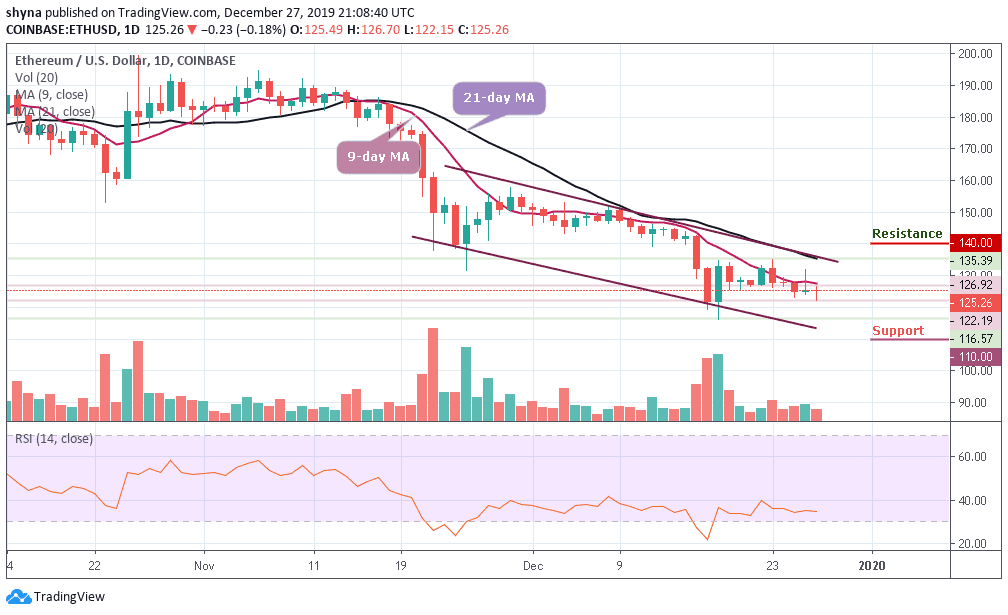
ETH/USD continues to struggle this week as it dropped by a slight 0.18% to bring the price for the coin down to $125. Ethereum (ETH) has now witnessed more than 15% price fall this month as it continues to trade within a long term descending price channel. A few days ago, the cryptocurrency was struggling to break resistance at $135.11 but it must overcome here to travel higher.
Looking ahead, if the sellers push ETH back beneath $125, initial support lies at $120. Beneath this, support is located at $115 and below the lower boundary of the channel, the critical support levels lie at $110, $100 and $90. Alternatively, if the buyers regroup and start to push higher, resistance is located at $135.39. Above this, resistance lies at $140, $150, and $160.
The RSI (14) indicator is trending around 35.16, next to the oversold zone if the price continues to move below the 9-day and 12-day moving averages and this indicates that the price could fall a bit more before it goes back up.
Against Bitcoin, Ethereum is currently trading at 0.0173 BTC after witnessing some heavy bearish moment in the last few days. Looking at the daily chart, the current trend of the coin is perpetually looking bearish in the short-term, but should the price break below the lower boundary of the channel, the new monthly low might be created.

However, a continuation of the downtrend could hit the main support at 0.0170 BTC before falling to 0.0165 BTC and below. More so, the buyers could probably push the market towards the critical potential resistance of 0.0185 BTC and above. The RSI (14) has dipped within the oversold zone, indicating that the sellers are in control over the market momentum.
Please note: Insidebitcoins.com is not a financial advisor. Do your research before investing your funds in any financial asset or presented product or event. We are not responsible for your investing results.
Join Our Telegram channel to stay up to date on breaking news coverage

