

Join Our Telegram channel to stay up to date on breaking news coverage
Price Hovers – June 16
The ETH/USD price hovers currently at the level of $2,500 to trade around the value of $2,535. The crypto economy now records a reduction of the percentage rate of about -0.38.
Price Hovers: ETH Market
Key Levels:
Resistance levels: $3,000, $3,500, $4,000
Support levels: $2,000, $1,800, $1,600
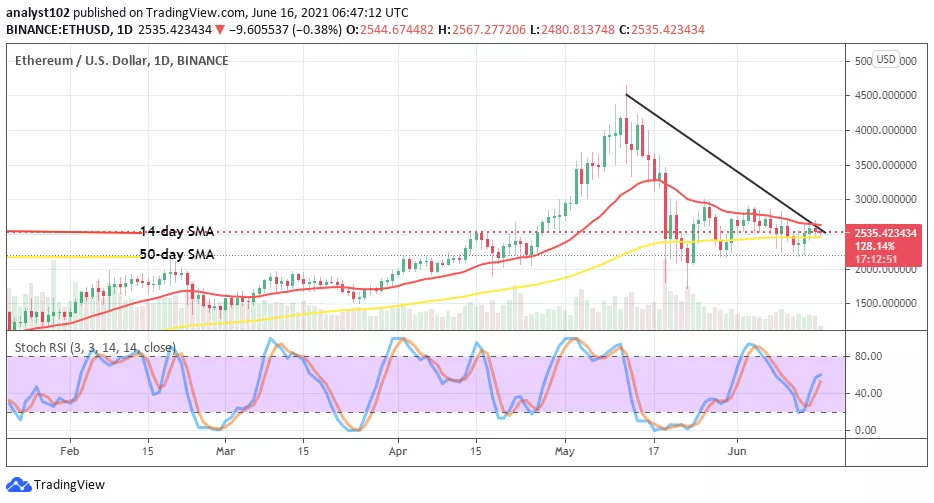
ETH/USD – Daily Chart
The ETH/USD daily chart reveals that the crypto’s price hovers around the value of %2,500 in between the small trading space of the SMAs. In the meantime, most of the higher values lost to the downside are yet to be recovered as the 14-day SMA trend-line is situated over the 50-day SMA indicator. And, the bearish trend-line drew across the bigger SMA from the top to find a lower point on top of the current smaller candlestick showcasing the market’s position. The Stochastic Oscillators have moved up from the oversold region in an attempt to close the lines between ranges 40 and 80. That could cause a pause or eventually lead to light downward pressure.
ETH/USD price hovers at $2,500, which direction price may go next?
Going by the reading of the smaller SMA’s reading, the ETH/USD price hovers to somewhat hit a resistance along the sell signal side of the trading indicator. That brings about the possibility of getting to see more hovering of price movements in the next session. Entering a long position in this market could be awaited until the price tends to go dip below the present trading stance of $2,500 in a bid to re-find support.
On the downside, the market downward-moving path to the south appears to still succumb to the sell signal side of the smaller SMA trend-line in determining a notable point. However, the pressures that have been occurring alongside the Indicator are not being weighty enough to project a long sustainable bearish trend continuation while price even dares to break down further as already observed in the previous operations.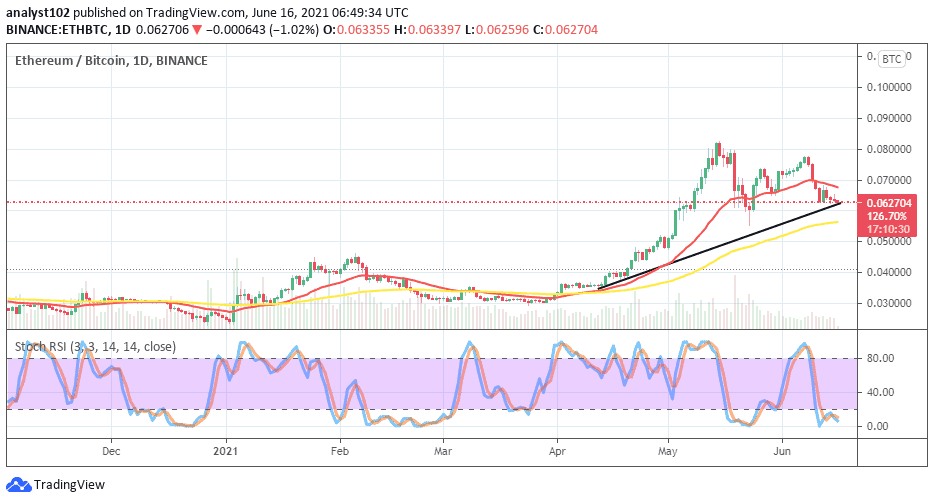
ETH/BTC Price Analysis
In comparison, not much has been lost to the downside as regards the trending weight between Ethereum and Bitcoin. In the process of what looks like correctional moves, the 14-day SMA trend-line has only breached to the south as the bullish trend-line drew below it in a supportive posture. And, the 50-day SMA indicators are located in the oversold region with conjoined lines seemingly trying to begin a consolidation moving style. That portends the near possibility that the base crypto may soon regain its momentum as paired with the most valuable counter crypto.
Looking to buy or trade Ethereum (ETH) now? Invest at eToro!
75% of retail investor accounts lose money when trading CFDs with this provider
Join Our Telegram channel to stay up to date on breaking news coverage