Join Our Telegram channel to stay up to date on breaking news coverage
ETH Price Prediction – October 15
Ethereum (ETH) price is trying to keep its upward movement, while the sellers kept on frustrating the movement.
ETH/USD Market
Key Levels:
Resistance levels: $200, $210, $220
Support levels: $160, $150 $140
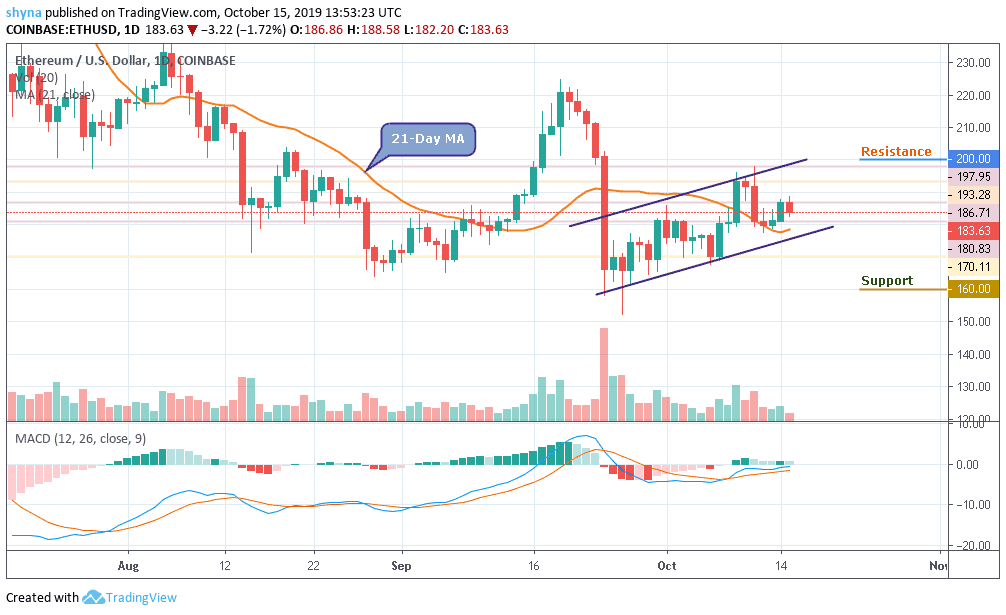
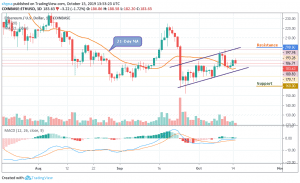
Ethereum price has been remarkably slow in its movement since October 13. The lethargic movement follows a lower correction from highs around $197.95 and the failure to break above this level must have discouraged the bulls while giving Ethereum bears a gap to explore. The lower correction stepped slightly under $185 during the last weekend session.
However, the 21-day moving average on the daily chart came out as strong support. This move allowed ETH/USD to push for reversal above $180 but the upside is limited under $180. At the moment, it was revealed that the bears are trying to step back into the market with a current movement coming to touch the orange-line of the 21-day moving average, which is heading towards a support level of $180.
Moreover, for a backward movement, the market can be supported at levels of $160 and $150 and if the price falls below the previous levels, another support is around $140. But should in case the price exceeds the indicated level, then, the resistance levels of $200, $210 and $220 may be visited. The daily MACD still generates some bullish signals while the trading volume is becoming low.
Comparing it with Bitcoin, it was discovered a few days ago that ETH/BTC pair broke down significantly to touch the orange-line of the 21-day moving average, after which the market released green candles two days ago. Today, the price started falling and it was shown on the Stochastic RSI as the signal line is found at the oversold boundary, which might be considered as a bearish sign for the market until a reversal occurs.
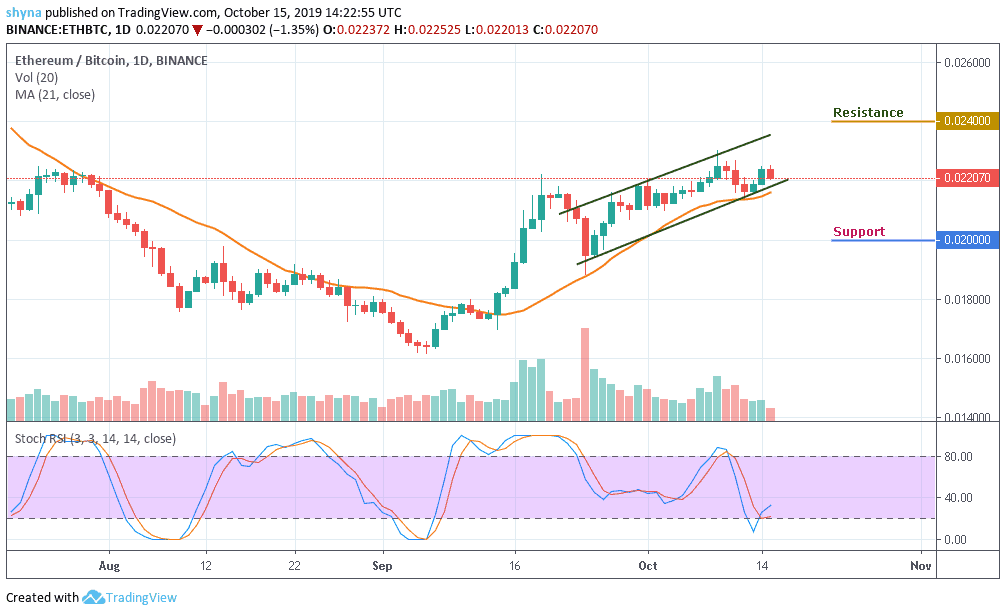
Furthermore, the market may continue to decline if the sellers put more effort to bring the price down to the support levels of 0.020 BTC, 0.018 BTC, and 0.016 BTC. Therefore, with the look of things, the price of Ethereum is likely to go up as high as 0.024 BTC, 0.026 BTC, and 0.028 BTC resistances as soon as the stochastic RSI turns upward to introduce new trend for the market.
Please note: Insidebitcoins.com is not a financial advisor. Do your research before investing your funds in any financial asset or presented product or event. We are not responsible for your investing results.
Join Our Telegram channel to stay up to date on breaking news coverage