Join Our Telegram channel to stay up to date on breaking news coverage
Ethereum Price Prediction – April 11
The ETH/USD financial book of records has it that on April 10, the crypto’s price briefly touched past the immediate resistance line of $2,200. But, today currently trades around a high value of $2,000.
ETH/USD Market
Key Levels:
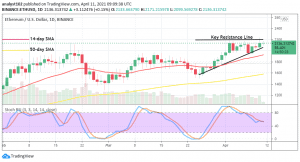
Resistance levels: $2,200, $2,400, $2,600
Support levels: $2,000, $1,800, $1.600
ETH/USD – Daily Chart
It is been showcased on the ETH/USD daily trading chart that the main resistance point is at the $2,200 mark. Price has continually striving to find support around the $2,000 level. The bullish trend-line has been closer below the current trading zone a bit over the 14-day SMA trend-line slightly pointing towards the north. The 50-day SMA indicator is situated underneath them with a space at $1,600 support line. The Stochastic Oscillators have a long-slanting bent across from the overbought region to near range 40. They have closed the hairs. That appears that the crypto-economy is in a relaxation moving manner.
Will ETH/USD in a near session strongly resist around the $2,200 level?
It is more pertinent that the main trading resistance of the $2,200 line will have to play a crucial role in determining the continuation of the ETH/USD market’s northward journey. Meanwhile, a long fluctuation trading situation at that point will cause indecision. As a result, bulls need intensification of building up more efforts towards breaching beyond the resistance trading zone as mentioned earlier.
It is at this point not visible that the bears are strongly bracing up to launch a come-back in this crypto-market. However, several failing attempts have been made by the ETH/USD bears to regain control of the market at the key resistance line. Based on that, it would be technically sound that another higher resistance northward away is awaited before considering looking for a decent sell position.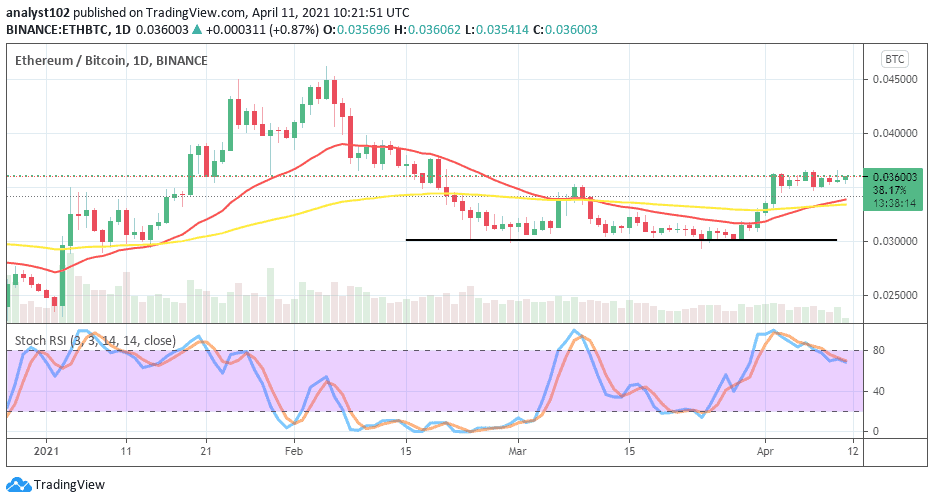
ETH/BTC Price Analysis
Comparing the capacity of price power between ETH and BTC, it is now seen that the counter crypto has been relatively relaxing in its effort as the base crypto pushes back briefly to the north. The 14-day SMA trend-line has crossed the 50-day SMA trend-line from the below towards the north. But, there is a formation of small higher lows to signify that the current market price trades in a kind of range-bound moving outlook. The Stochastic Oscillators have slantingly bent across from the overbought region to a bit below range 80. That indicates that a degree of consolidation is ongoing in the market. That can in most cases result in seeing the base trading instrument to get an increase at expense of weakness trading stance that the counter trading tool may be putting up in near session.
Join Our Telegram channel to stay up to date on breaking news coverage