Join Our Telegram channel to stay up to date on breaking news coverage
Ethereum Price Prediction – March 12
A base-line at $1,400 has formed to mark a pivotal spot from which Ethereum has regained its lost momentum against the US Dollar. The crypto’s value now trades once again closer to the previous higher value of $2,000 from the below.
ETH/USD Market
Key Levels:
Resistance levels: $2,000, $2,200, $2,400
Support levels: $1,500, $1,300, $1,100
ETHUSD – Daily Chart
Having had a set-up of base-line for the ETH/USD price-moves with the support of the bigger SMA trend-line from below, it shows that more up-trends are still expected to come to play in the crypto-trade business transactions. The 14-day SMA, points slightly to the north underneath the current trading spot. And, it is located above the 50-day SMA. The Stochastic Oscillators have moved into the overbought region. They have closed the hairs near at range 80. That could lead to witnessing a line of consolidation movements in a near session.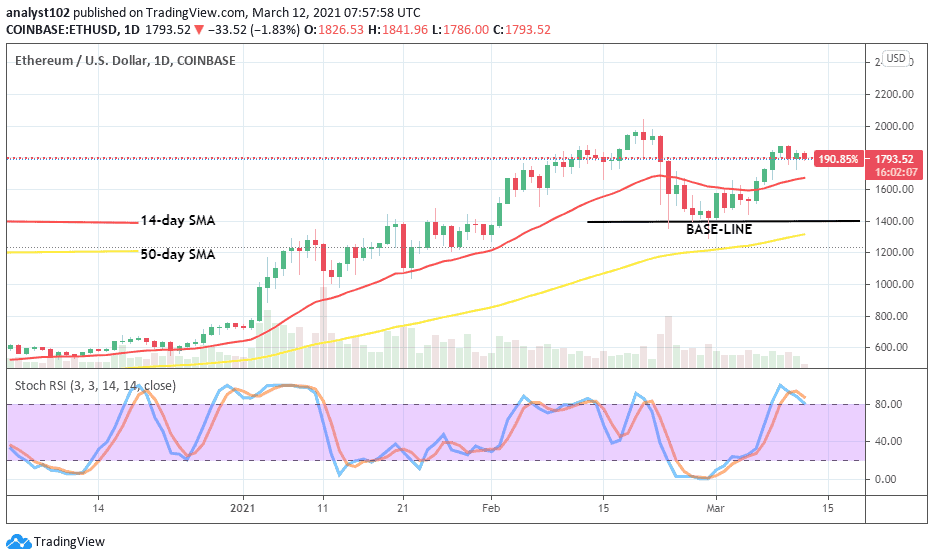
Will ETH/USD market successfully trade past $2,000?
Going by the market-strength evaluating tool, presently, the ETH/USD bulls seem not to have it on a full-fledged outlook to push beyond the $2,000 level for sustainability in the near sessions. On the contrary, an emergence of a daily bullish full-body-candlestick against the resistance level will project into seeing higher values in the crypto-trading operations.
On the downside, ETH/USD bears may have to be on the lookout for either a rejection at the previous resistance point of $2,000 or a breakdown of the 14-day SMA around $1,700 and, that can potentially lead to bringing the crypto’s to a lower worth of $1,500 or extend to touching the base-line at $1,400 for the second time. A further break of that line may cause sellers to get trapped.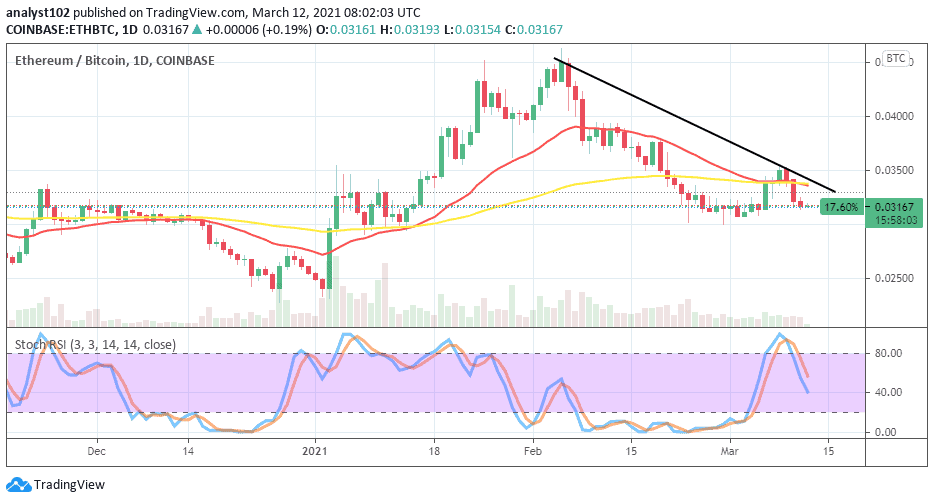
ETH/BTC Price Analysis
Currently, the market-weight between ETH and BTC as depicted by the trading chart shows that the base-crypto has been under relative pressure in comparison. There has been a serial drop in the valuation of Ethereum as paired with Bitcoin running into several weeks of trading sessions. The 14-day SMA has joined with the 50-day SMA from the top as price moves underneath them. The Stochastic Oscillators now point to the south at range 40. That shows the possibility of seeing the downward pressures not being exhausted yet.
Join Our Telegram channel to stay up to date on breaking news coverage