

Join Our Telegram channel to stay up to date on breaking news coverage
Ethereum Price Prediction – April 18
There has now been a downward volatile move in the ETH/USD market worth. That trading situation is brought about as a result of the crypto’s gradual loss of power to push northward further during the last April 16 day’s session.
ETH/USD Market
Key Levels:
Resistance levels: $2,400, $2,600, $2,800
Support levels: $1,800, $1,600, $1,400
ETH/USD – Daily Chart
The emergence of today’s bearish has left a serious warning sell signal against the ETH/USD bulls’ stance in the market. Currently, there has been a breakdown and a pull-up against the 14-day SMA trend-line. The bullish trend-line is drawn to touch a point at $2,200 over the smaller SMA buy signal side. The 50-day SMA indicator is located at a mid-point between $1,800 and $1,600 levels. The Stochastic Oscillators have crossed from the overbought region to point towards the south around range 40. That still signifies the presence of downward pressure in the market.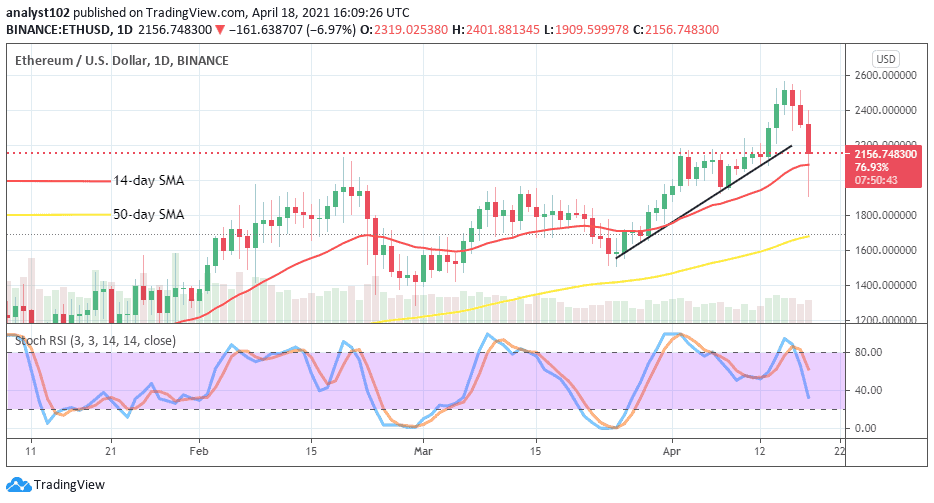
Will the ETH/USD bears continue to press down in the market?
With the current space of falling pressures in the ETH/USD market, it may not last long. It could as well eventually lead to letting in a quick buy position in the course of featuring a kind of downward reversal move pattern. If the downward price reversal finally takes its full form against the $2,400 immediate resistance level that will most probably allow the market to get pumped into a higher trading level above the late point closer to the high of $2,600.
The $2,400 trading level remains the vital line below the ETH/USD bears need to keep a stronghold of the market. A breakout of that line will lead the crypto-market settle for another upper rejecting line at a later session. With that said, a repeat of a down-move at $2,000 level will pose a serious warning to getting to see upsides in near sessions.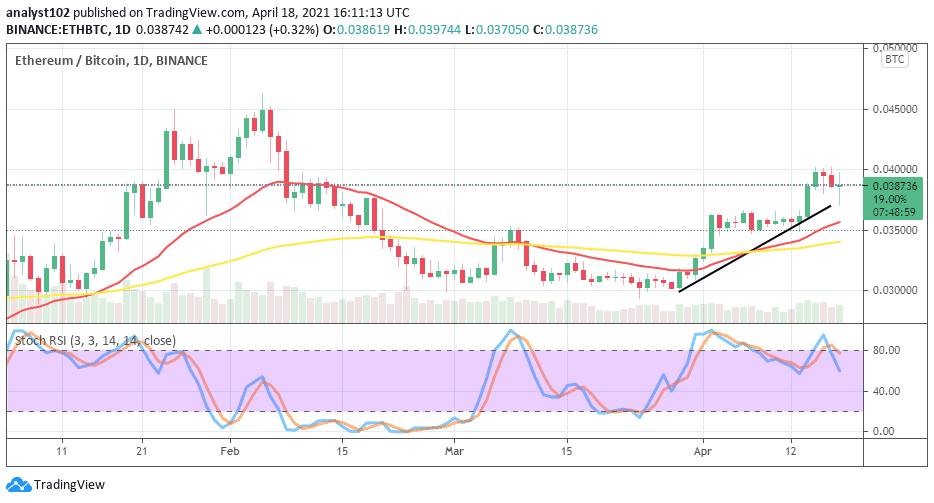
ETH/BTC Price Analysis
It is depicted on the chart that the market weight of ETH as compared with BTC still features that the base instrument is at the start of regaining stand. The 14-day SMA trend-line remains crossed over the 50-day SMA indicator to the north. There has been a small chain of higher lows to indicate that the base crypto is in a less-active manner to push further. The Stochastic Oscillators have slightly crossed the hairs to the south around range 80. That signifies a consolidation move is taking place between the two crypto pairs. And, it may result in letting the base crypto continue to have the market advantage.
Join Our Telegram channel to stay up to date on breaking news coverage
