Join Our Telegram channel to stay up to date on breaking news coverage
Since the start of 2023, ETH has seen more green lines, even though the crypto market’s volatility has not changed. ETH has experienced shares of declines, but there have been longer strides of a bullish run.
Today June 22, 2023, the coin is selling at $1,896, with a 4.49% increase at the time of writing in the last 24 hours. There are fluctuations in the stability of the price, and market analysts could easily predict a decline below $1,800.
However, the currency’s trading volume is up by 29.40%, suggesting that activities in the ETH market could also favor the bulls. Irrespective of the strong bullish signals for Ethereum, its price action and technical analysis could hint at where the next support level will be.
Ethereum Price Changes in the Last Six Months
In January, ETH market traders experienced significant gains as the coin’s price value steadily increased from its original position.
The coin started the year at $1,196, rose within days, and by January 21, it was at a peak level of $1,661. However, the January market ended with ETH selling at $1,586.
February opened with trades going back to the $1,600 mark, and while the price fluctuated, the market rallied up to $1700 by month’s end. Several inconsistencies can be found in ETH charts in the month of March.
The market’s volatility increased, and the price of the coin dwindled back and forth. On March 20, Ethereum hit its first high for the year at $1,801. The gain was momentous and soon settled down to $1,792 for the remainder of the month.
April recorded the most surge period in the first quarter of 2023. First, it started with a selling price of $1,911 on April 6. Then, the consistency continued, spiking the market price in mid-April to $2,010.
Although the price was not constant throughout the month, it stayed above the $1,800 mark. The movements in May continued from the effects experienced in the previous month.
The bulls kept pushing and eventually propelled the figures back to the $2,000 range. Few pips were dropped off the mark, but it did not dip as much as it did in June.
The drop in May could be referred to as a forerunner with respect to June’s market activity. The bears came strong to press down the value of Ethereum.
As the pressure increased due to external forces, ETH finally dropped to a low of $1,650 on June 15, a 21.21% decrease under a 30-day count.
It was the biggest decrease the currency had seen throughout the year and was strong enough to generate doubts about the coin’s liquidity.
The coin remained number two on the CoinMarketCap rankings, but several speculations on the coin’s future were raised in different crypto communities. A primary speculation is that the bulls may be getting exhausted by the inconsistent up and downs of the currency.
Ethereum Price Outlook Based on Technical Indicators

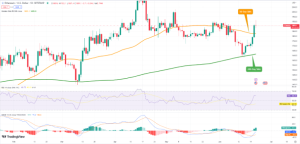
According to technical indicators on Tradingview, Ethereum is in its short and long-term bullish market.
The Moving Average Convergence/Divergence (MACD) indicator is above the signal line with a bold green bar on the histogram, suggesting possible price rallies to $1900 before the day ends.
Nevertheless, the Relative Strength Index (RSI) indicator is at 60.72, representing ETH’s market position in neutral as it resides between 30 (oversold) and 70 (overbought).
Although the RSI is on a straight line, an increase in BUY trades could send it above 70 (overbought zone), making it an overvalued crypto in the market as the price will spike.
However, if the selling pressure surpasses the buyers, the RSI could initiate a movement towards the oversold zone (below 30), suggesting fluctuations and a trend reversal in the future.
Notwithstanding, ETH is trading above its 50-Day and 200-Day Simple Moving Averages (SMA), indicating a short and long-term bullish market. As such, the crypto could see more price gains beyond the $1900 level in the coming weeks.
ETH Support and Resistance -Where Will the Next Support Level Be?

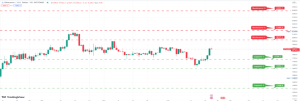
ETH’s support levels are $1310.9, $1594.1, and $1734.1. In contrast, its resistance levels are $2017.3, $2160.5, and $2443.7.
Ethereum (ETH) is trading above its strongest support level of $1734.1, indicating possible price fluctuations amid the coin’s bullish trend. On the other hand, its resistance levels show the tendencies that Ethereum could reach a new milestone of $2000 in the nearest future.
Note that cryptocurrencies are volatile and can differ predicted price action. Thus, proper risk management strategies and in-depth technical analysis must be in place before investment.
Experts’ Short and Long-Term Price Prediction for Ethereum
Considering the price outlook of Ethereum, many crypto experts and analysts have aired their perspectives on how the crypto could perform in the short and long term.
Here are experts’ price predictions for ETH for 2023 and beyond.
Ethereum Price Prediction by Finder from 2023 to 2030
According to Finder, based on fundamental and technical analysis, ETH is predicted to reach a peak price of $2,758 in 2023. However, the coin would likely close the year around the $2,300 mark.
Predictions from these experts also say that by the end of 2025 and even further into 2030, Ethereum will hit $ 5,491 and $14,814, respectively.
Of the 32-man panel that took part in the survey, 53% strongly believe that investors should buy ETH now, 33% suggest token holding, while a minority, 13%, favor an outright sell-off.
Ethereum Price Prediction by PricePrediction from 2023 to 2030
Price prediction predicts the minimum, average, and maximum prices for Ethereum to be around $2126.17, $2194.86, and $2365.76, respectively, by the end of 2023.
In 2025, the crypto could increase further to a maximum of $5177.67, an average of $4456.67, and a minimum of $4300.29.
Moreover, in the next 5 years (2026 to 2030), Ethereum is predicted to spike, reaching a maximum of $31,168.09, an average of $26,442.21, and a minimum of $25,496.20 by 2030.
Factors Affecting the Price of Ethereum
Cryptocurrencies are subject to several factors within and outside the crypto market, including macroeconomic activities, supply and demand laws, regulatory crackdowns, public sentiment, network-related developments, etc.
As such, this recent news and developments in the Ethereum ecosystem could be some of the factors affecting its price performance.
Shanghai Upgrade Results in Over 20 Million ETH Staked on Various Staking Services
Earlier today on Twitter, a crypto report profile, Wu Blockchain, shared a report on the number of Ethereum staked across several staking services after the Shanghai Upgrade.
In relation to the data from a crypto analytics platform, Token Unlocks, over 20 million ETH worth $38.25 billion is staked, and the rate has reached 16.43%.
According to Wu Blockchain, the net staking amount following the upgrade has exceeded 3.66 million ETH with a 5.98% annual interest rate on the current staking.
Apart from the increased rate of staking activities, the number of validators rose to 5%. Besides the lucrative rewards that come with staking, this act can mitigate liquidity risks in the Ethereum market.
Join Our Telegram channel to stay up to date on breaking news coverage


