Join Our Telegram channel to stay up to date on breaking news coverage
ETH Price Prediction – July 14
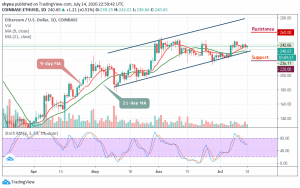
Ethereum (ETH) breaks above $240; a stronger retest of previous resistance is expected.
ETH/USD Market
Key Levels:
Resistance levels: $260, $270, $280
Support levels: $220, $210, $200

At the time of writing, despite the downside correction, ETH/USD is still nearly 0.51% higher on a day-to-day basis. At the moment, Ethereum (ETH) is trading at $240.65 while testing a 9-day moving average. However, the value of the crypto is growing slowly after opening the session at $238.86 today.
However, the initial support is created below the lower boundary of the channel at $232. Once this is eliminated, the sell-off may increase with the next focus on the $225 level. If this support level drops, the downward momentum could begin to snowball and the next downside target to $220, $210, and $200.
Moreover, as the daily chart reveals, the bulls must realize the need to clear the $245 level before they can get to the potential resistance levels. Above this handle, traders will need to consider a sustained move for the extended recovery to the resistance levels at $260, $270, and $280. Meanwhile, the stochastic RSI is moving below the 65-level, suggesting bearish signals.
Against Bitcoin, trading at the 0.026 BTC, the daily chart reveals that the bulls are attempting to step back into the market as the coin is showing some promising signs that could break above the upper boundary of the channel. On the upside, the nearest resistance level lies at 0.0268 BTC, above this, higher resistance lies at 0.0270 BTC and above.
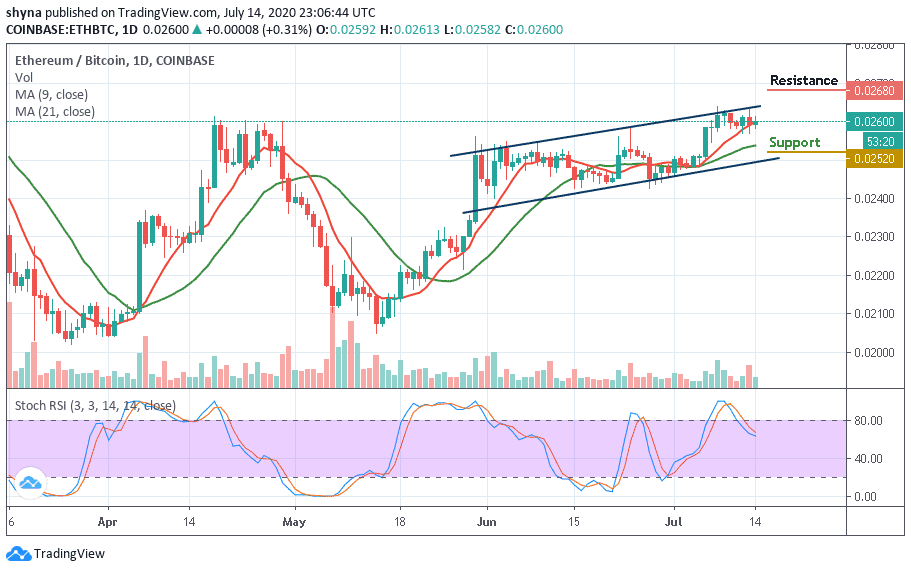
Moreover, looking at the downside, the critical support level lies at 0.0250 BTC. If the price drops further to create another low, lower support is located at 0.0252 BTC and below. Meanwhile, the stochastic RSI is seen moving out of the overbought zone, trying to cross below 70-level which indicates that the bears may come into play.
Join Our Telegram channel to stay up to date on breaking news coverage