Join Our Telegram channel to stay up to date on breaking news coverage
ETH Price Prediction – June 28
The price to buy Ethereum saw a 1.83% price hike today as the coin rises to the $227 resistance level.
ETH/USD Market
Key Levels:
Resistance levels: $245, $255, $265
Support levels: $200, $190, $180

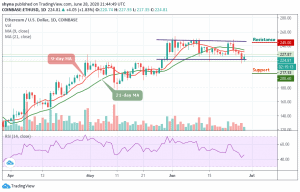
ETH/USD experienced a small price decline today and it is currently trading at $224.81. The cryptocurrency continues to be supported at the $215 level but it seems that the bears are adamant to push the coin lower. More so, Ethereum (ETH) is gaining over 1.83% within 24 hours.
However ETH/USD keeps following the downtrend within the channel formation, trading below the 9-day and 21-day moving averages. Looking at the daily chart, after the opening of the market, the daily price chart shows that ETH/USD also falls from $217.53 to $215, where it found short-term support and later bounced up to $224.81, where it is currently trading.
Moreover, for a backward movement, the market can be supported at $200 and $190 levels, if the price falls below the previous levels; another support is around $180. But should in case the price exceeds the indicated level by moving upward, then, the resistance levels of $245, $255, and $265 may be visited. The RSI (14) rises above 45-level, which may likely give some bullish signals.
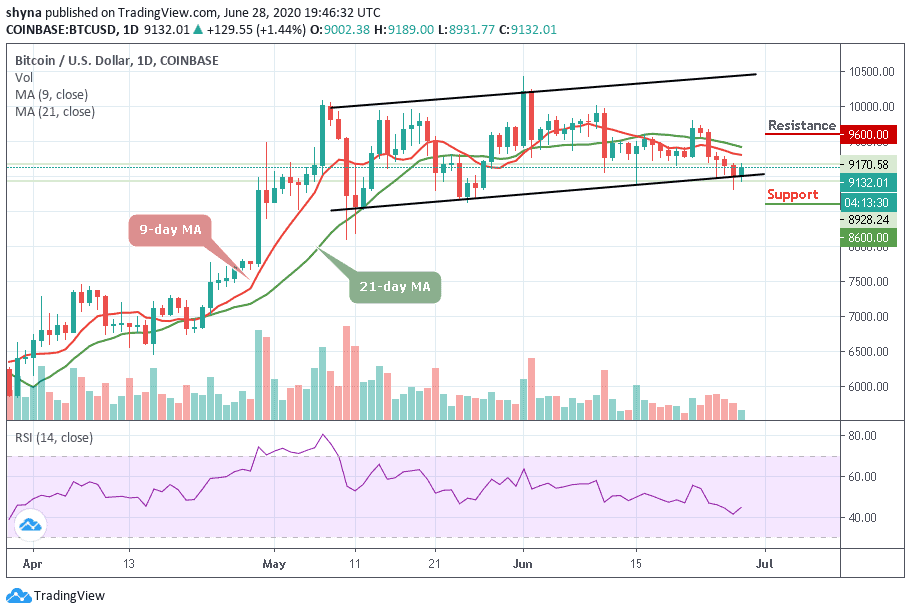
Comparing with Bitcoin, as the green-line of the 21-day moving average is above the red-line of the 9-day moving average, the market price may continue to keep the uptrend. ETH/BTC is currently trading at the 2465 SAT and if the market begins to drop, the next key supports may likely be at 2300 SAT and below.
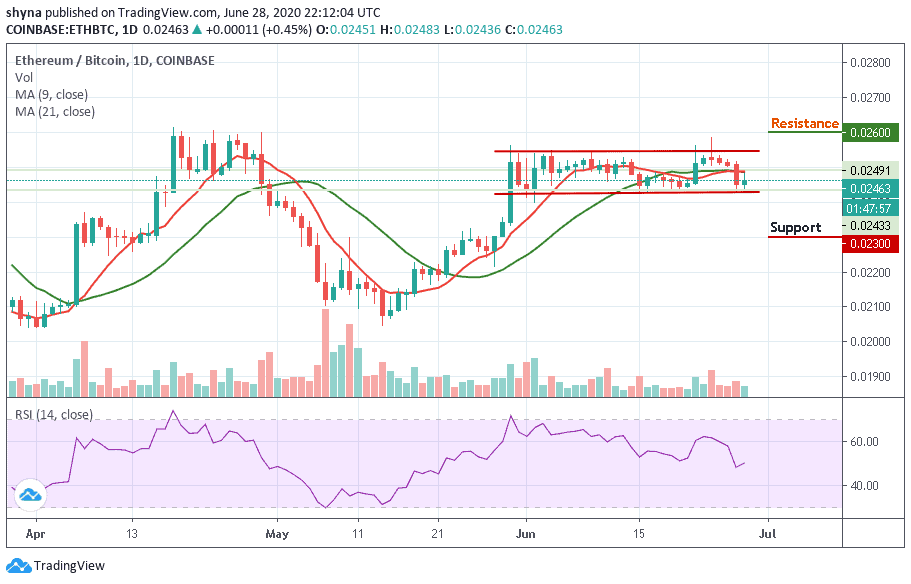
On the upside, a bullish continuation above the channel may likely come into play, when this is done, the resistance level of 2600 SAT and above could be visited. Meanwhile, the market may have a bearish day because the technical indicator RSI (14) moves around 50-level, which could give more bullish signals for a while.
Join Our Telegram channel to stay up to date on breaking news coverage