Join Our Telegram channel to stay up to date on breaking news coverage
Key Highlights ETH price has started an upside correction and it moved above $590 against the US Dollar. There was a break above a key bearish trend line with resistance at $592 on the hourly chart of ETH/USD (data feed via Kraken). The pair is now approaching another important bearish trend line with resistance at $620 on the same chart.
Ethereum price is slowly moving higher against the US Dollar and Bitcoin. ETH/USD may rise further towards a crucial resistance zone at $620.
Ethereum Price Resistance
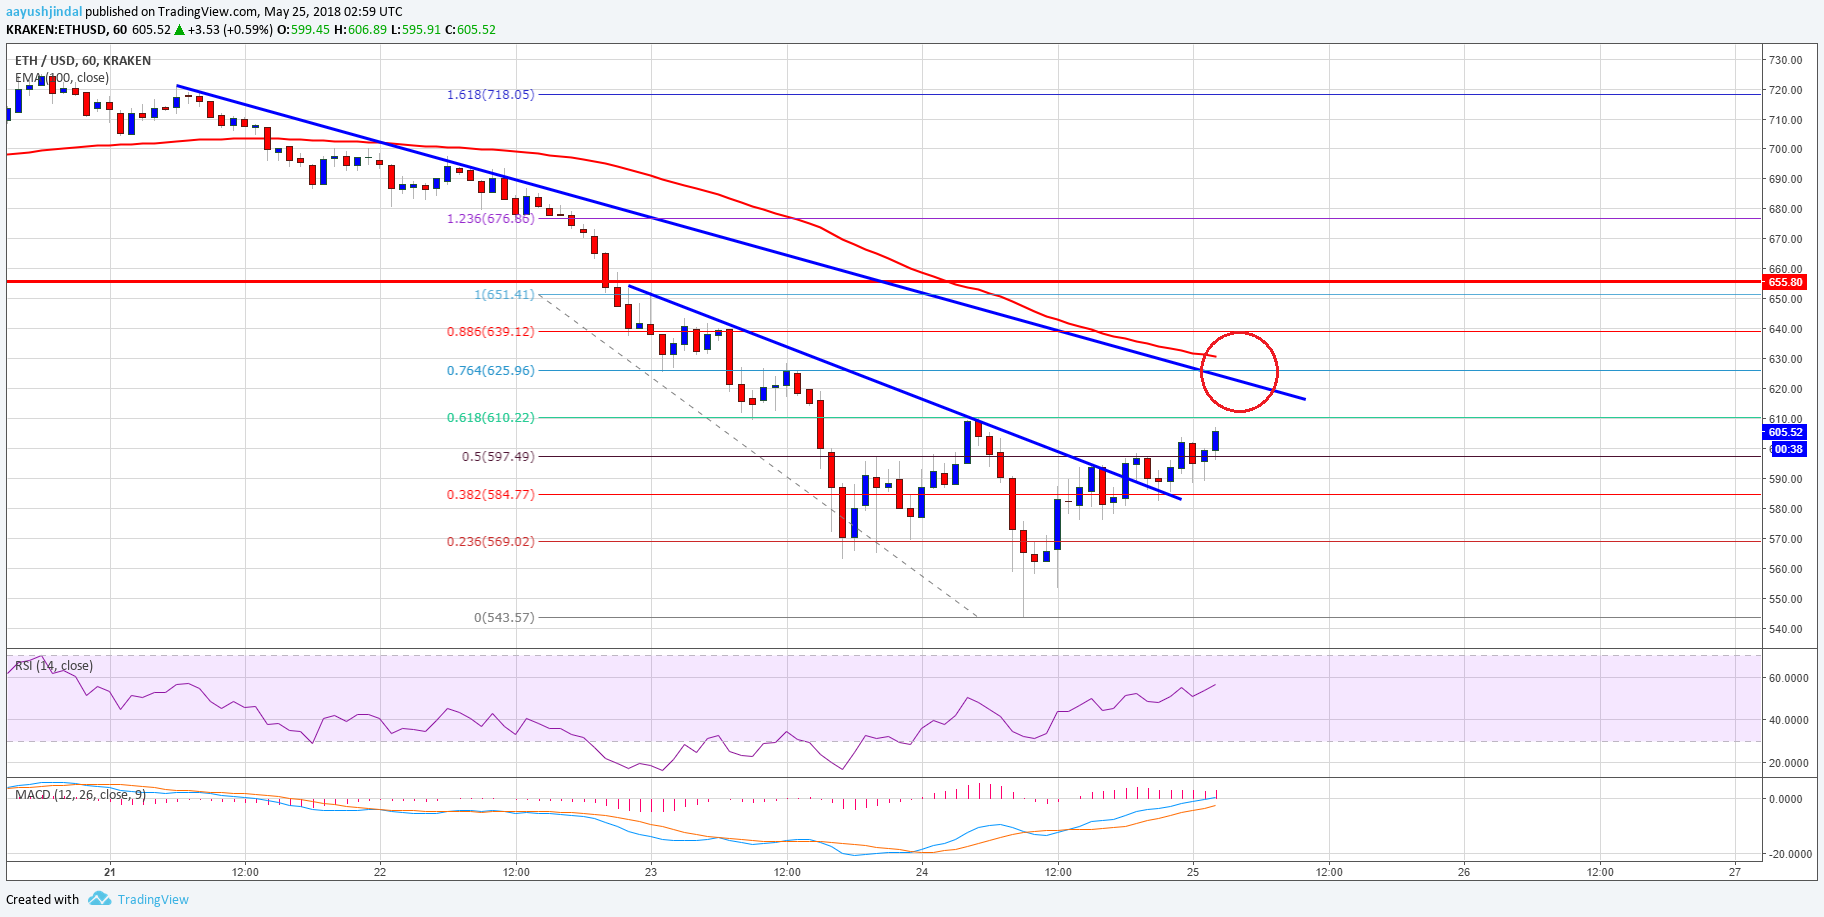
There were further declines below $580 in ETH price against the US Dollar. The price traded towards the $540 level where buyers appeared. A low was formed at $543.57 before an upside correction wave was initiated. Buyers pushed the price above the $560 and $580 resistance levels. Moreover, there was a break above the 38.2% Fib retracement level of the last decline from the $651 high to $543 low.
During the upside move, there was a break above a key bearish trend line with resistance at $592 on the hourly chart of ETH/USD. The pair is currently attempting a close above the 50% Fib retracement level of the last decline from the $651 high to $543 low. It seems like the price may rise further above $610 in the near term. However, there is another important bearish trend line with resistance at $620 on the same chart. The trend line resistance near $620 is close to the 100 hourly simple moving average.
Looking at the chart, the price has to move above the $620 resistance and the 100 hourly SMA to gain upside momentum. A close above $620 may perhaps push the price towards $640 and $650. On the downside, the $580 level is a decent support, followed by $560.
Hourly MACD – The MACD is now back in the bullish zone.
Hourly RSI – The RSI is moving higher and is currently placed nicely above the 50 level.
Major Support Level – $580
Major Resistance Level – $620
The post Ethereum Price Analysis: Can ETH/USD Break 100 SMA? appeared first on NewsBTC.
Join Our Telegram channel to stay up to date on breaking news coverage