Join Our Telegram channel to stay up to date on breaking news coverage
The Ethereum Classic price prediction shows that ETC may cross below the moving averages as the selling pressure increases.
Ethereum Classic Prediction Statistics Data:
- Ethereum Classic price now – $43
- Ethereum Classic market cap – $5.9 billion
- Ethereum Classic circulating supply – 136.3 billion
- Ethereum Classic total supply – 210.7 billion
- Ethereum Classic Coinmarketcap ranking – #19
ETC/USD Market
Key Levels:
Resistance levels: $60, $65, $70
Support levels: $30, $25, $20
Your capital is at risk.
ETC/USD is likely to slow down and may settle below the $40 support level. However, the market price breaks down today, touching its lowest daily level at $42.85. In addition, the current performance of Ethereum Classic is below the normal expectations as the coin may soon recover from this downtrend.
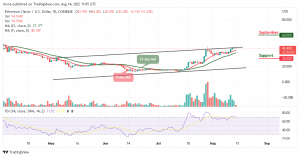
Ethereum Classic Price Prediction: What Could Be the Next Direction for Ethereum Classic?
If the Ethereum Classic price fails to push the price above the upper boundary of the channel, there is a risk of a fresh bearish wave. However, if the coin drops below the 9-day and 21-day moving average, the initial support may be located at the $35 level where the market price could restart its decline.
As the technical indicator Relative Strength Index (14) reveals the possible downtrend, any movement out of the overbought region could lead to critical supports at $30, $25, and $20. Nevertheless, a high swing above the upper boundary of the channel could take the bulls to a key resistance level of $50. If this is possible, the coin may trigger a bullish rally which could take the market price to $60, $65, and $70 resistance levels.
When compared with Bitcoin, the daily chart reveals that the sellers may continue to show some commitment to the market movement. However, following the recent negative signs, the trend may continue to go down if the bears keep on putting more pressure on the market.
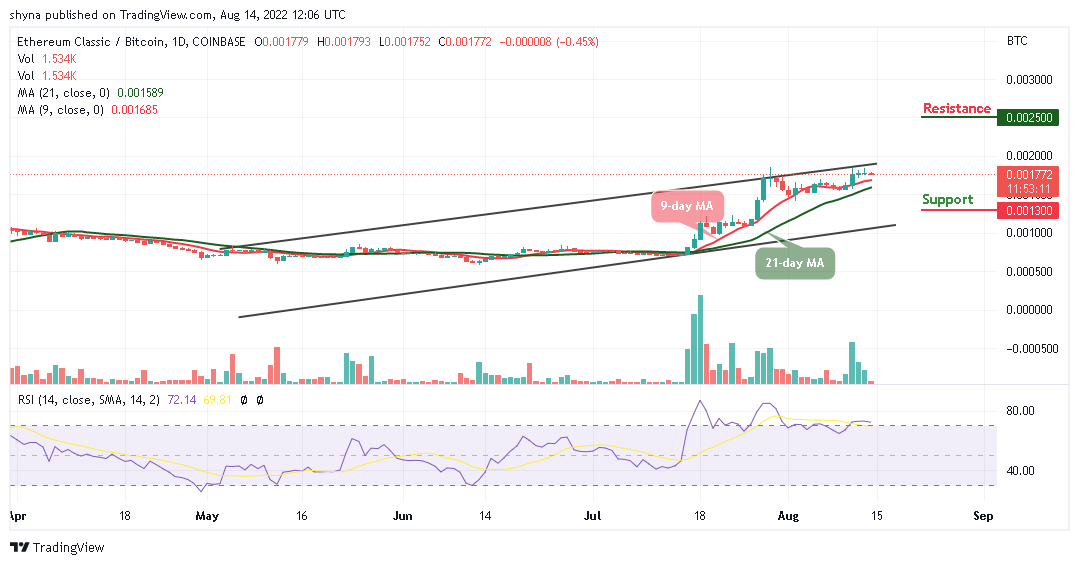
However, as the technical indicator Relative Strength Index (14) moves to leave the overbought region, if the buyers failed to hold the support of 42 SAT, the market price may focus on the downtrend, and crossing below the moving averages may take it to the nearest support at 30 SAT and below but a rebound could take the price above the upper boundary of the channel to locate the resistance at 60 SAT and above.
Related
Join Our Telegram channel to stay up to date on breaking news coverage